Introduction
Hey everyone! I know, this isn’t your monthly #SportsVizSunday data challenge or the weekly thread of awesome sports vizzes, this is #WorkoutWednesday, but with a sports twist. My name is Spencer Baucke, co-founder of #SportsVizSunday and consultant at Tessellation. I was suuuuper excited when the #WoW crew reached out and asked if we wanted to be a part of the Community Month, so of course we said yes. This month we are going to bring some of the #SportsVizSunday world to the #WorkoutWednsday community, so let’s hop into the fun!
Requirements
- Dashboard Size: 900px by 600 px
- # of Sheets – main part is the table, please make it 1!
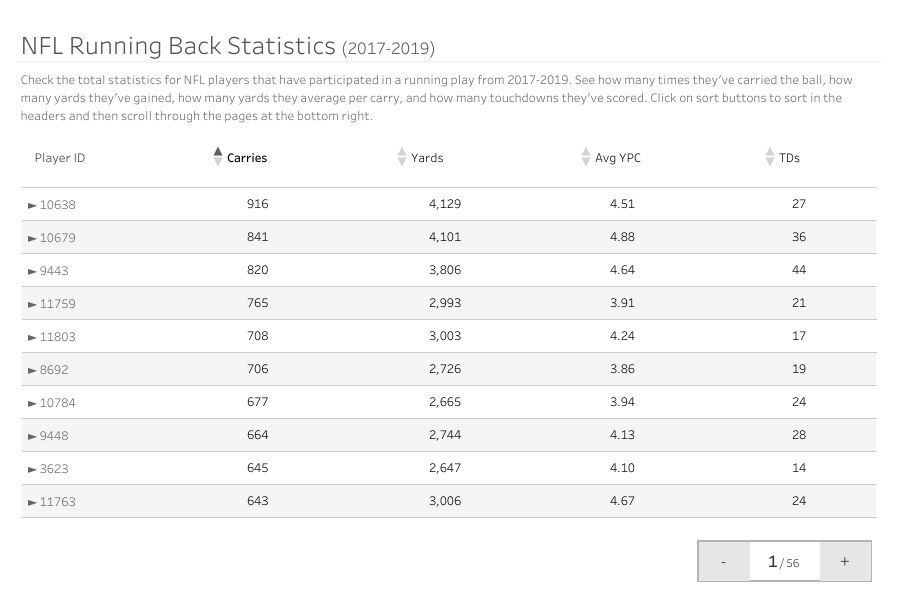
- Sort the players by Carries, Yards, Avg YPC, and TDs using up and down arrows
- Drill into Player ID to show by Year
- Match formatting
- Match tooltips
- I want your focus to be the functionality of the sorting and drop down, the formatting would be a nice touch!
Dataset
This week the data we are using was provided to us by Eric Eager, an Applied Mathematician and Data Scientist at Pro Football Focus, a sports analytics company in Cincinnati, OH. Each row of this data represents a running attempt by an NFL player for the 2017-2019 seasons. Each rushing attempt includes columns details about that rush. Examples of this are what type of run concept the offense ran, how many yards were needed to gain a first down, how many yards were earned, if a touchdown was scored or not, and how many yards were gained after the defense-first made contact with the runner. You can get it here at data.world
Attribute
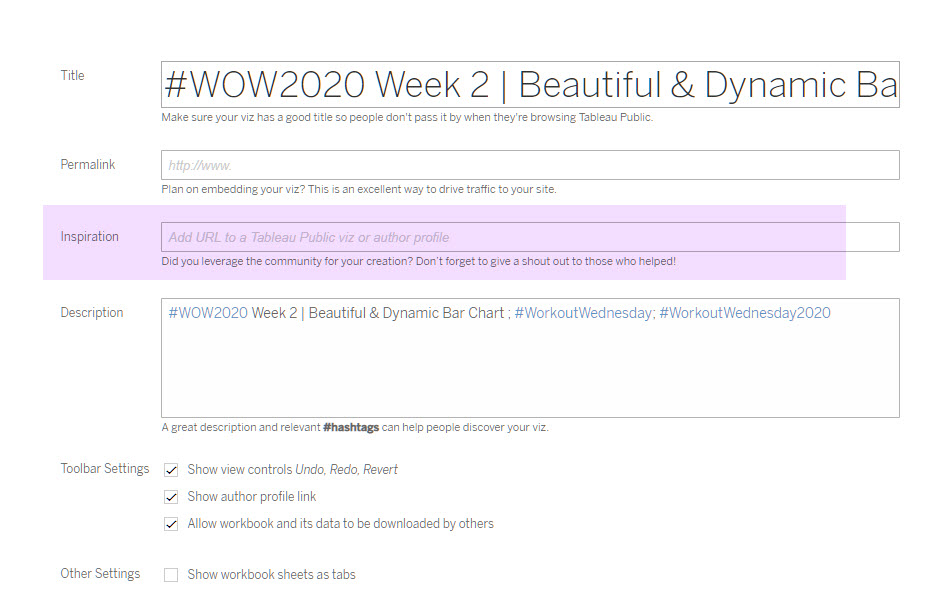
When you publish your solution on Tableau Public make sure to take the time and include a link to the original inspiration. Also include the hashtag #WOW2020 in your description to make it searchable!

Share
After you finish your workout, share on Twitter using the hashtag #WOW2020 and tag @AnnUJackson, @LukeStanke, @_Lorna_Brown, @jsbaucke and @HipsterVizNinja
