Month: April 2020

2020 Week 18: Which products were most profitable?

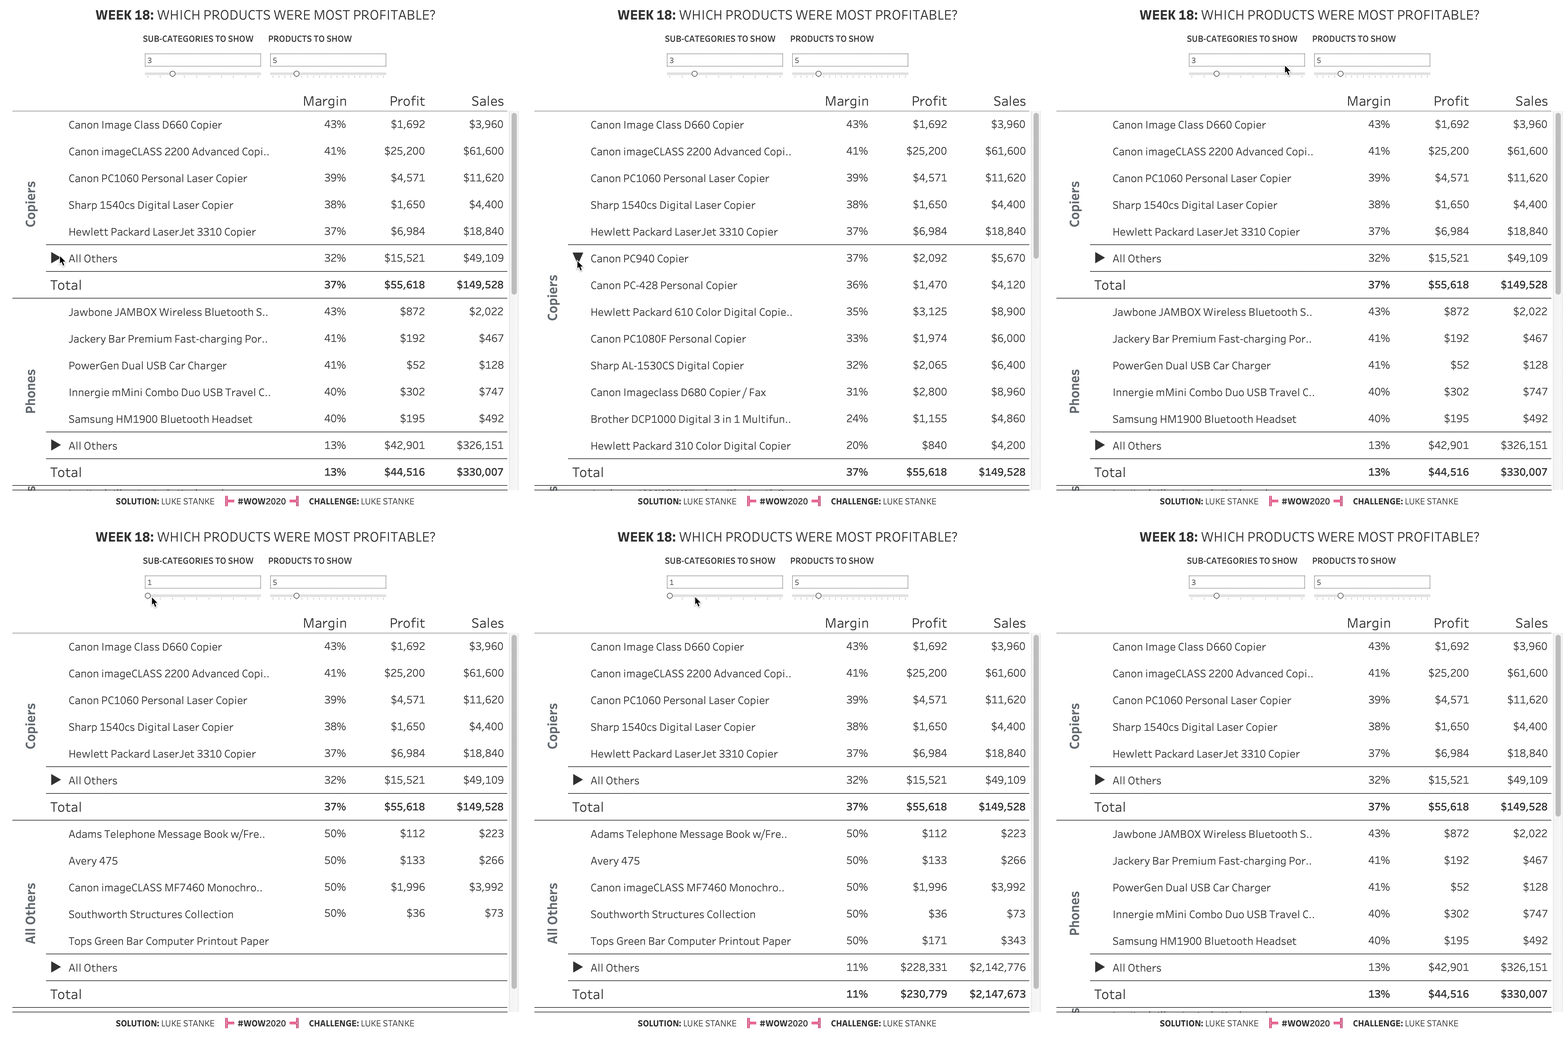
Introduction Sometimes you want to make fun charts, but life gives you tables. This challenge is another real-life challenge I’ve encountered through Dr. Alicia Bembenek: show a table, but only highlight a subset of the products. An innocent challenge that is actually more difficult than it first appears. –LS. Be sure to check out the …

2020 Week 18: Which products were most profitable? Read More »
2020 Week 16: Can you show the adjusted target & missing pipeline?

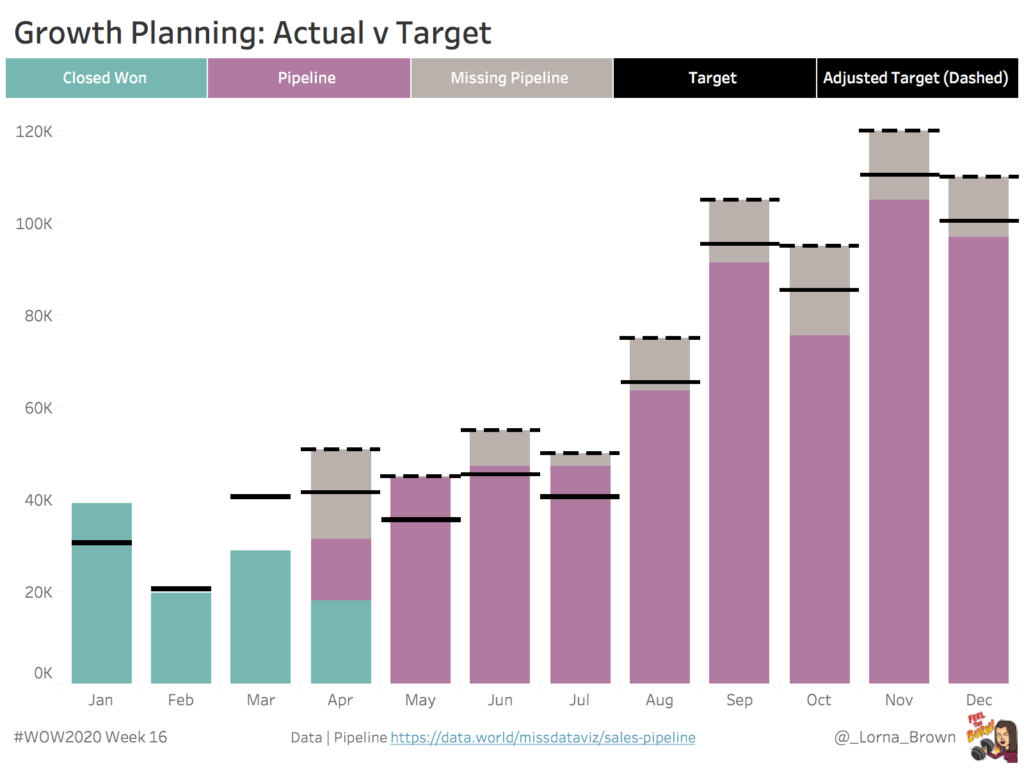
Introduction This week I was challenged with building a chart which shows an Adjusted target and the missing pipeline if targets were not met. So I challenge you, can you adjust the targets and show missing pipeline from the adjusted target. Click to open in Tableau Public Requirements Dashboard Size: 800 x 600 px # …

2020 Week 16: Can you show the adjusted target & missing pipeline? Read More »