Introduction
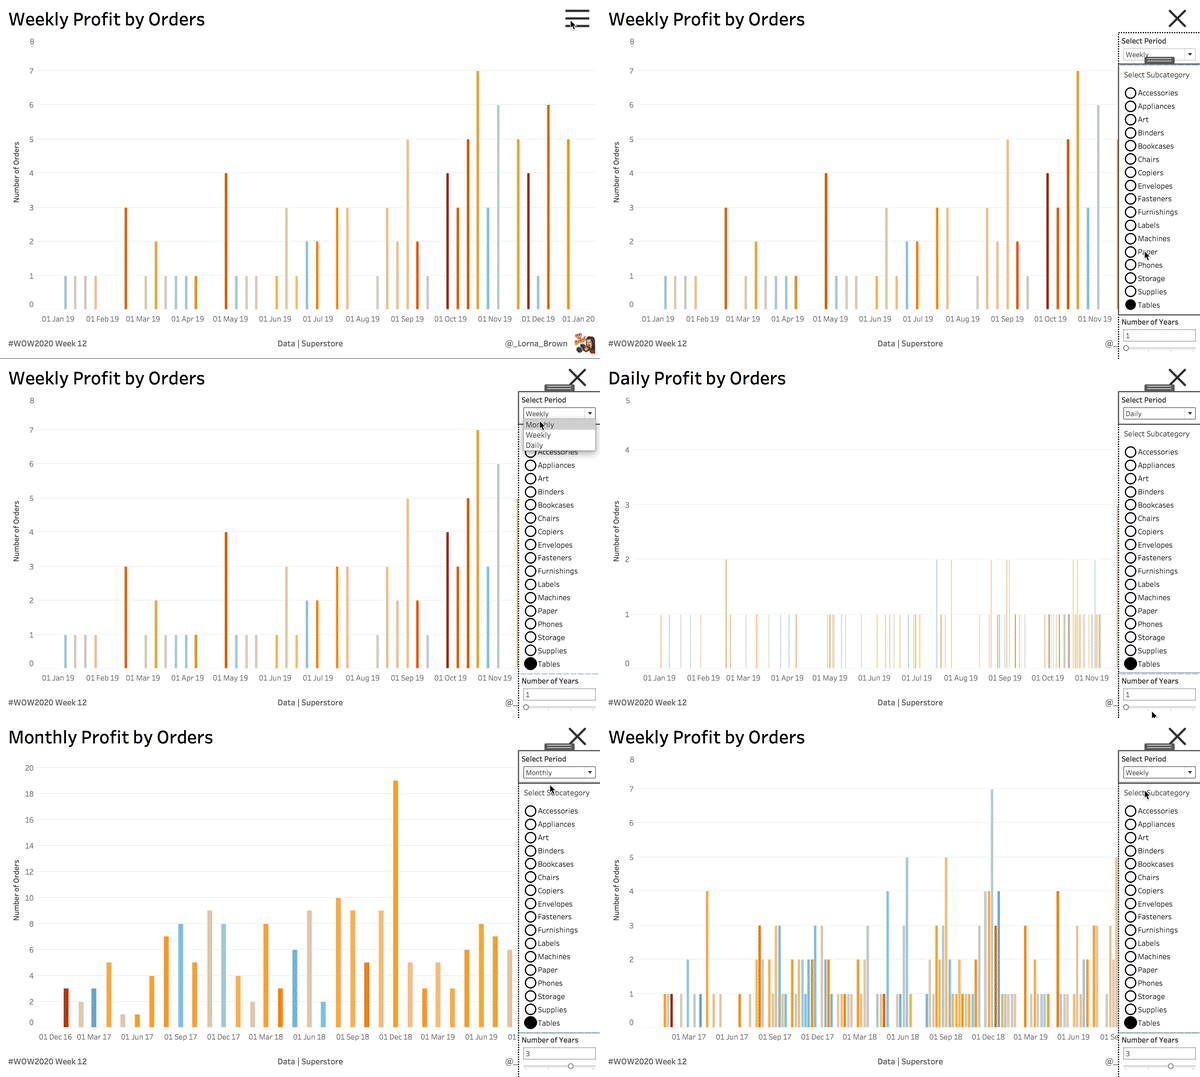
It’s good to be back WOWsers. This week is looking at showing missing selected periods and autosizing bars based on the selected period (Monthly, Weekly, Daily). It also gives Set Actions some love. The dates idea came from Michael McFadden.
Requirements
- Dashboard Size: 1000px by 600 px
- 2 Sheets
- Create a chart showing Number of Orders per selected period date
- Date is either Monthly, Weekly or Daily depending what is selected
- How many periods shown is based on another parameter
- Use SET ACTIONS only for Sub Category selections
- When you select a different period (Monthly, Weekly, Daily), there will be more marks for daily compared to weekly.
- Find a way to make these autosize by period
Dataset
This week uses the superstore dataset for Tableau 2020.1. You can get it here at data.world
Attribute
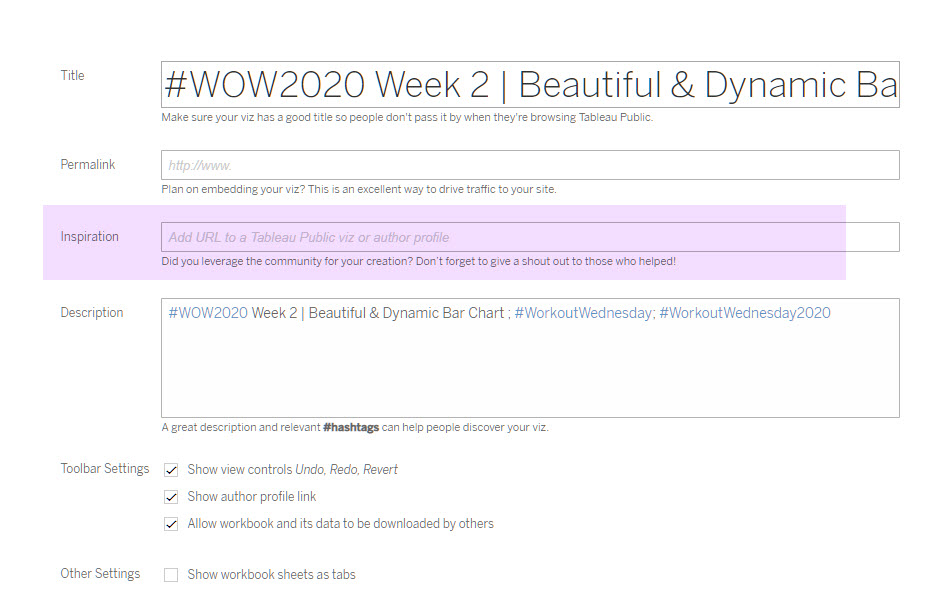
When you publish your solution on Tableau Public make sure to take the time and include a link to the original inspiration. Also include the hashtag #WOW2020 in your description to make it searchable!

Share
After you finish your workout, share on Twitter using the hashtag #WOW2020 and tag @AnnUJackson, @LukeStanke, @_Lorna_Brown and @LosaniMeera

Hi Lorna,
nasty width:) here’s my shot https://bit.ly/WoW2020w12