Introduction
Congratulations! We are now halfway through 2020 – it’s been a remarkable year, certainly full of twists, turns, and the unexpected.
The purpose of this week’s challenge is to demonstrate how a metric compares to a goal. Like most goal data I encounter, the sales goals for this challenge don’t reside in the same source system as the actual sales. Similarly, the goals aren’t quite as granular as what we have in the source system. These two items pose an interesting situation and the focus of our challenge this week.
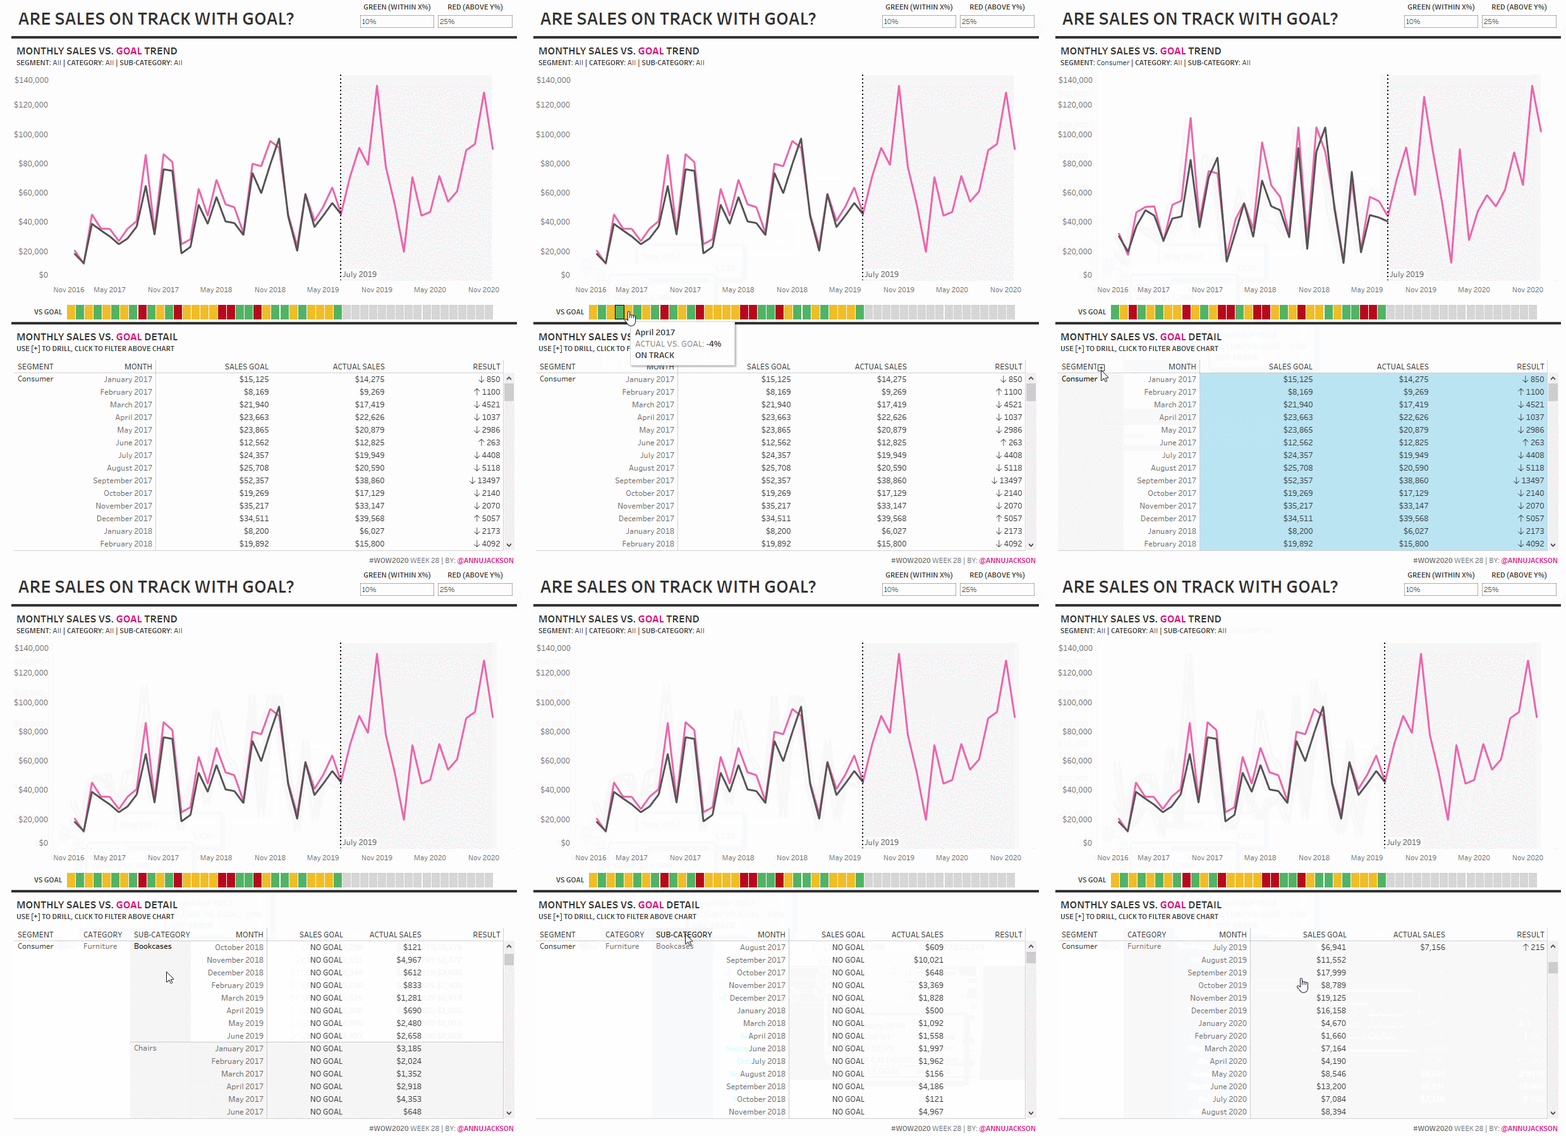
You’ll be creating a line chart to show the trend of actual sales vs. goal and a detailed table view to accompany it. The twist? Sales goals don’t go as granular as the table, so you’ll have to set it up so your audience views the correct information.
I will forewarn you that this challenge was designed to take advantage of the data modeling (relationships) capabilities that 2020.2 brings. If you don’t have 2020.2, I am confident you will be able to finish the challenge, but you’ll be using either data blending or LODs to resolve for some of the issues we’re now offloading to logical modeling.
Requirements
- Dashboard Size: 800 px by 900 px
- # of Sheets – up to you
- Create a monthly chart that compares actual sales vs. goal
- Create an indicator that is dynamic to denote whether the actual sales was on track compared to goal or off track – this logic is based off of the absolute value of the percentage difference
- Create a data table that allows the user to drill from Segment -> Category -> Sub-Category
- When at the Sub-Category level, no goal information will display, because there isn’t any
- At higher levels (Segment and Category), the goals should display
- Add interactivity, such that the user can filter by any of the 3 major dimensions
- Match tooltips and any additional formatting
You’ll have to play along with me and pretend we’re in 2019. I’ve set a parameter to be static that assumes we’re on July 1, 2019 – aka your sales should end in June 2019 and everything else should be “the future.”
Dataset
This week uses the Superstore data set for Tableau 2019.4 and a Sales Goal file I’ve created. I have modified Superstore to be easier to work with for data modeling, both files are available here.
Attribute
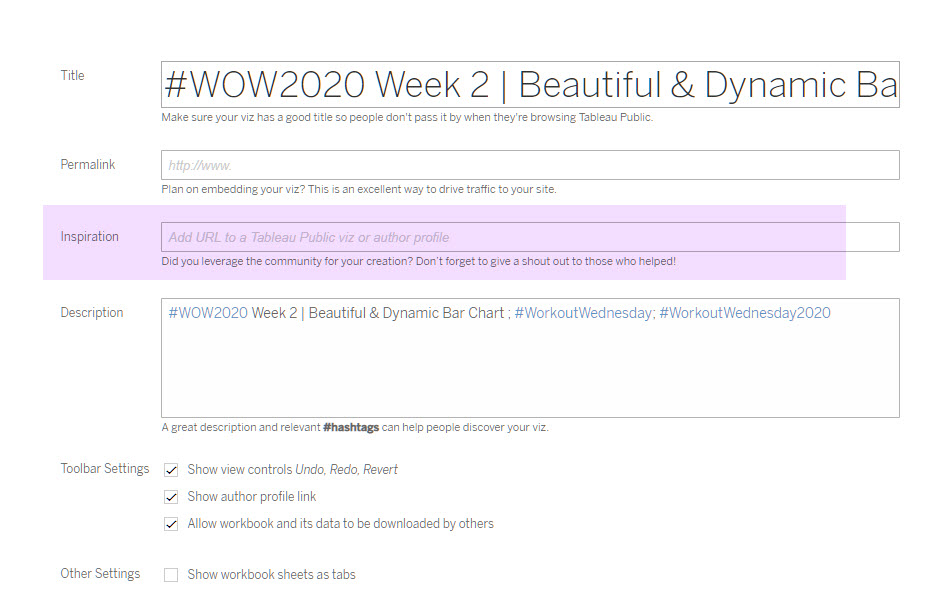
When you publish your solution on Tableau Public make sure to take the time and include a link to the original inspiration. Also include the hashtag #WOW2020 in your description to make it searchable!

Share
After you finish your workout, share on Twitter using the hashtag #WOW2020 and tag @AnnUJackson, @LukeStanke, @_Lorna_Brown, @HipsterVizNinja and @IvettAlexa

Why you use ”’min(sub-category) = max(sub-category)’? What dose this mean?