Introduction
Hey #WOW2020, Emma Whyte here. It’s been a blast being back building a Workout Wednesday! It’s been about 2 years 7 months since my last WOW with Andy Kriebel when we kicked off this project in 2017. It’s been fun, and a little bit stressful, getting back into the mindset of setting a weekly challenge.
I took a trip back through our WOW’s from 2017 and stumbled across a drill down challenge from week 41. I wondered if any of the newer features in Tableau made this challenge any easier? Answer was pretty much NO!
Requirements
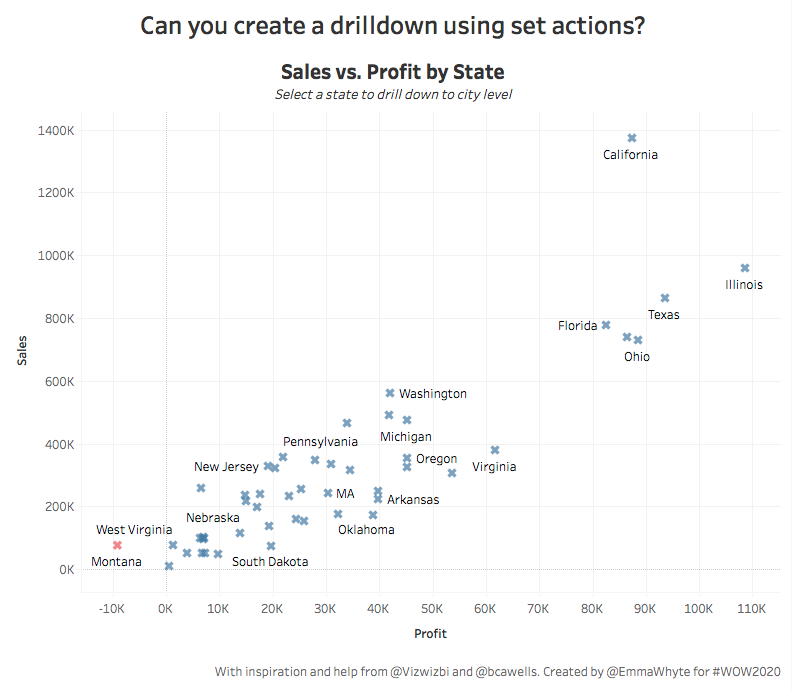
Your challenge this week is to create a scatterplot drill down.
- The scatterplot should start at state level and by clicking a state should drill down to city level for the state you’ve selected
- Clicking a city mark should drill you back up to state level
- Create the drill down with set actions. No dashboard filter actions, etc.
- Create the title and make sure it changes depending on what has been selected
- Marks are coloured red if they are unprofitable and blue if they are profitable
- Match the tooltips and formatting
- Dashboard size 800*700
Dataset
This week uses a sample of the superstore dataset. You can get it here at data.world
Attribute
When you publish your solution on Tableau Public make sure to take the time and include a link to the original inspiration. Also include the hashtag #WOW2020 in your description to make it searchable!

Share
After you finish your workout, share on Twitter using the hashtag #WOW2020 and tag @EmmaWhyte, @AnnUJackson, @LukeStanke , @_Lorna_Brown and @HipsterVizNinja
Solution
