Introduction
I’m really putting myself out there this week. But it’s for a good cause, so here we go!
If you aren’t familiar, I love listen to music…who doesn’t though, right? Pretty sure I’m in the majority here. Anywho, being that my second hobby is data visualization, I really like visualizing about music. So anytime I get to bring those two hobbies together, I do.
I created a version of this challenge for my blog but it’s more personalized than makes sense for this challenge so we’re going to be making a modified version of it. I think my favorite part about this challenge is that you have the option to swap out the supplied with your own data (if you have a last.fm account and are scrobbling your spotify history). That part if up to you.
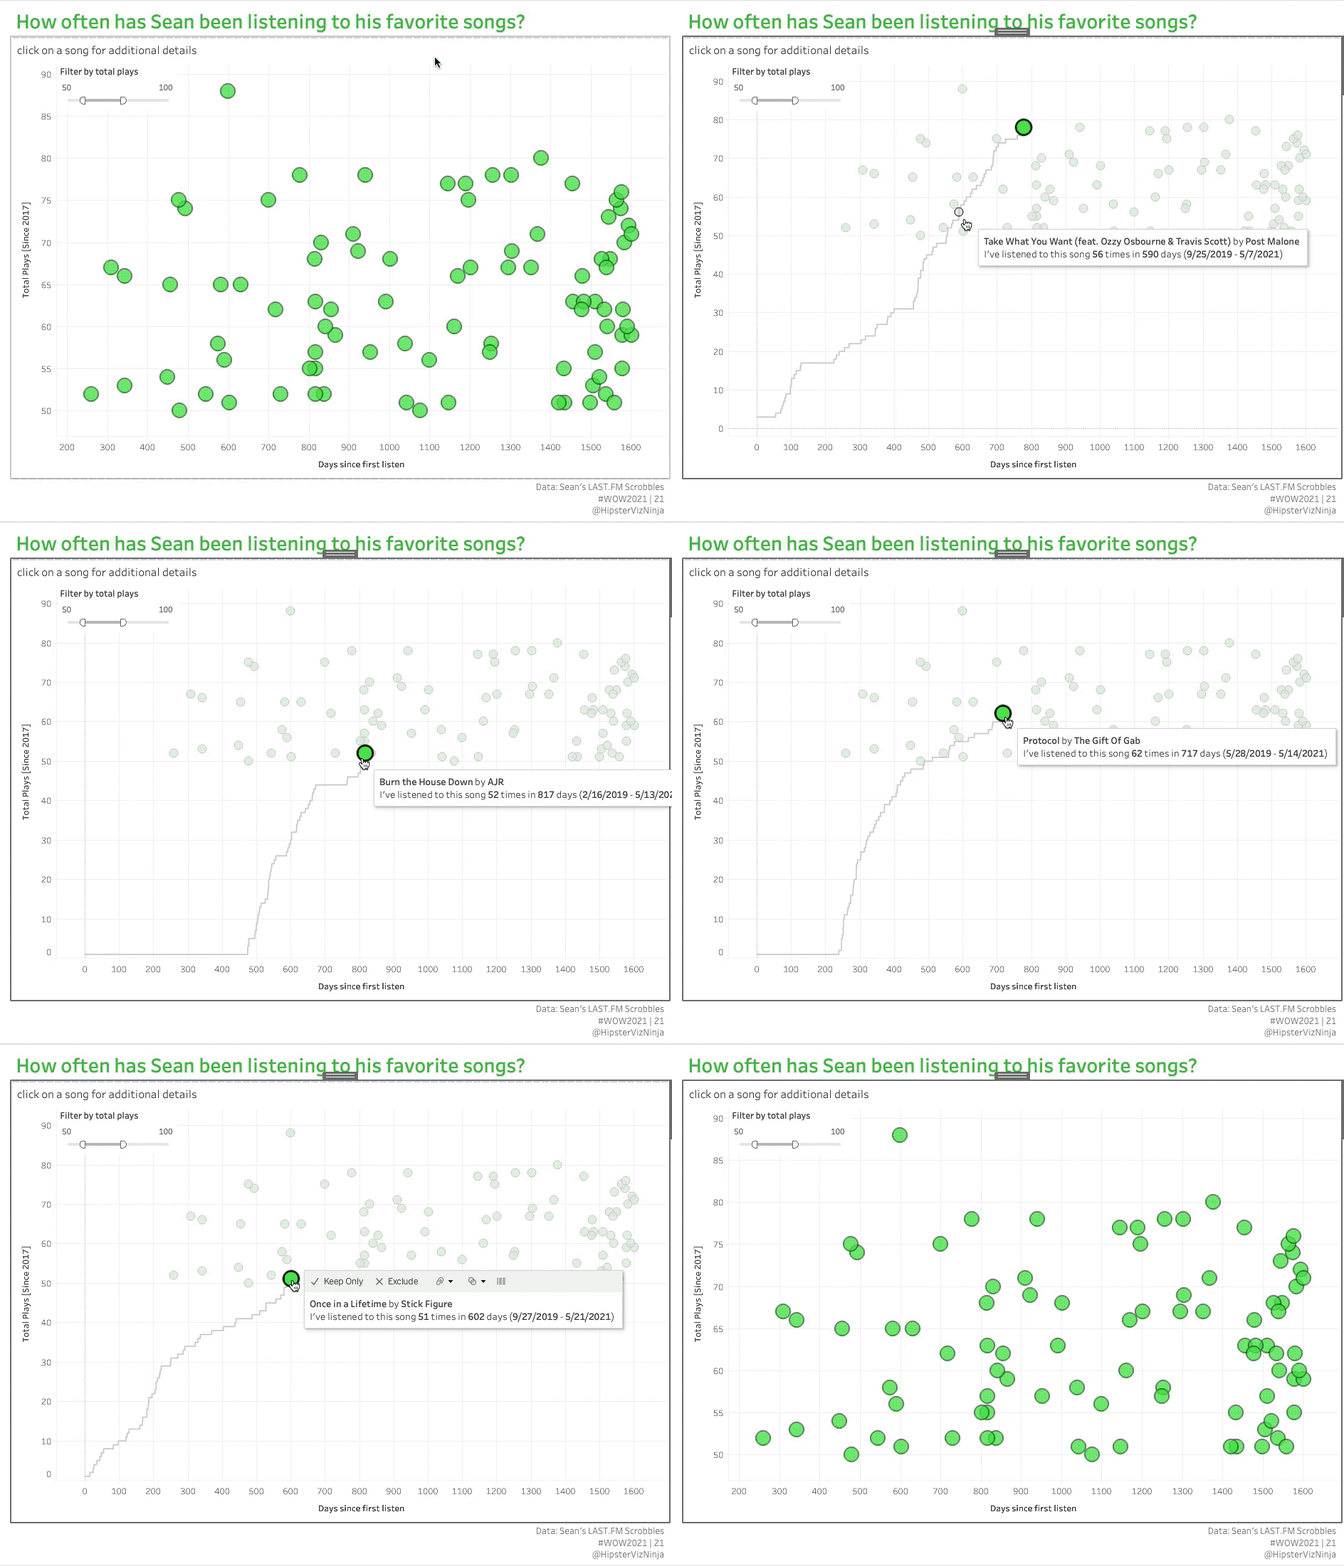
So what is this chart? Well on the surface it seems like a simple scatterplot but when you click a dot (or song) you get to see a running timeline of times listened. It’s not as simple and straightforward as it may seem so just have fun! And before you go and judge my listening habits, I should preface this with our entire family listens with my one account, and when young kids find a song they love, they don’t want to listen to anything else!
Requirements
- Dashboard Size: 1000px by 800 px
- # of Sheets – up to you
- Create a scatterplot
- X axis: Days since I first listened to the song
- Y axis: Total times I’ve listened to the song
- each dot represents a unique songID
- Enable filtering by range of total listens
- When you click on a song, we want to see a trend line of each listen
- Match tooltips and all other formatting
- Green dot color: #3DDE3C
- Green title color: #30B130
Dataset
This week uses my listening activity output from last.fm. You can get it here at data.world
If you have a last.fm account and interested in seeing your own listening data, you can download your own data here and swap data sources!
Attribute
When you publish your solution on Tableau Public make sure to take the time and include a link to the original inspiration. Also include the hashtag #WOW2021 in your description to make it searchable!

Share
After you finish your workout, share on Twitter using the hashtag #WOW2021 and tag @AnnUJackson, @ItsCandraM, @LukeStanke, @_Lorna_Brown and @HipsterVizNinja

I am trying to create ‘Total Plays’/’Total Plays_fixed’ fields from the workbook. But I am unable to recreate it using table calculations. I am new to table calculations. Can someone please guide me on this?