Introduction
This week I team up with Erica Hughes to create this fabulous challenge. I had an idea in my head to recreate something similar to the Brush Filter challenge by Sean. In my mind I did it with Parameter Actions, however when speaking to Erica she showed me the Set Actions Version. So that’s what we went with. Erica kindly provided me with her solution and I loved it so much I decided to use it for this challenge. So thank you Erica!
Requirements
- Dashboard Size: 1000px by 800 px
- # of Sheets – up to you
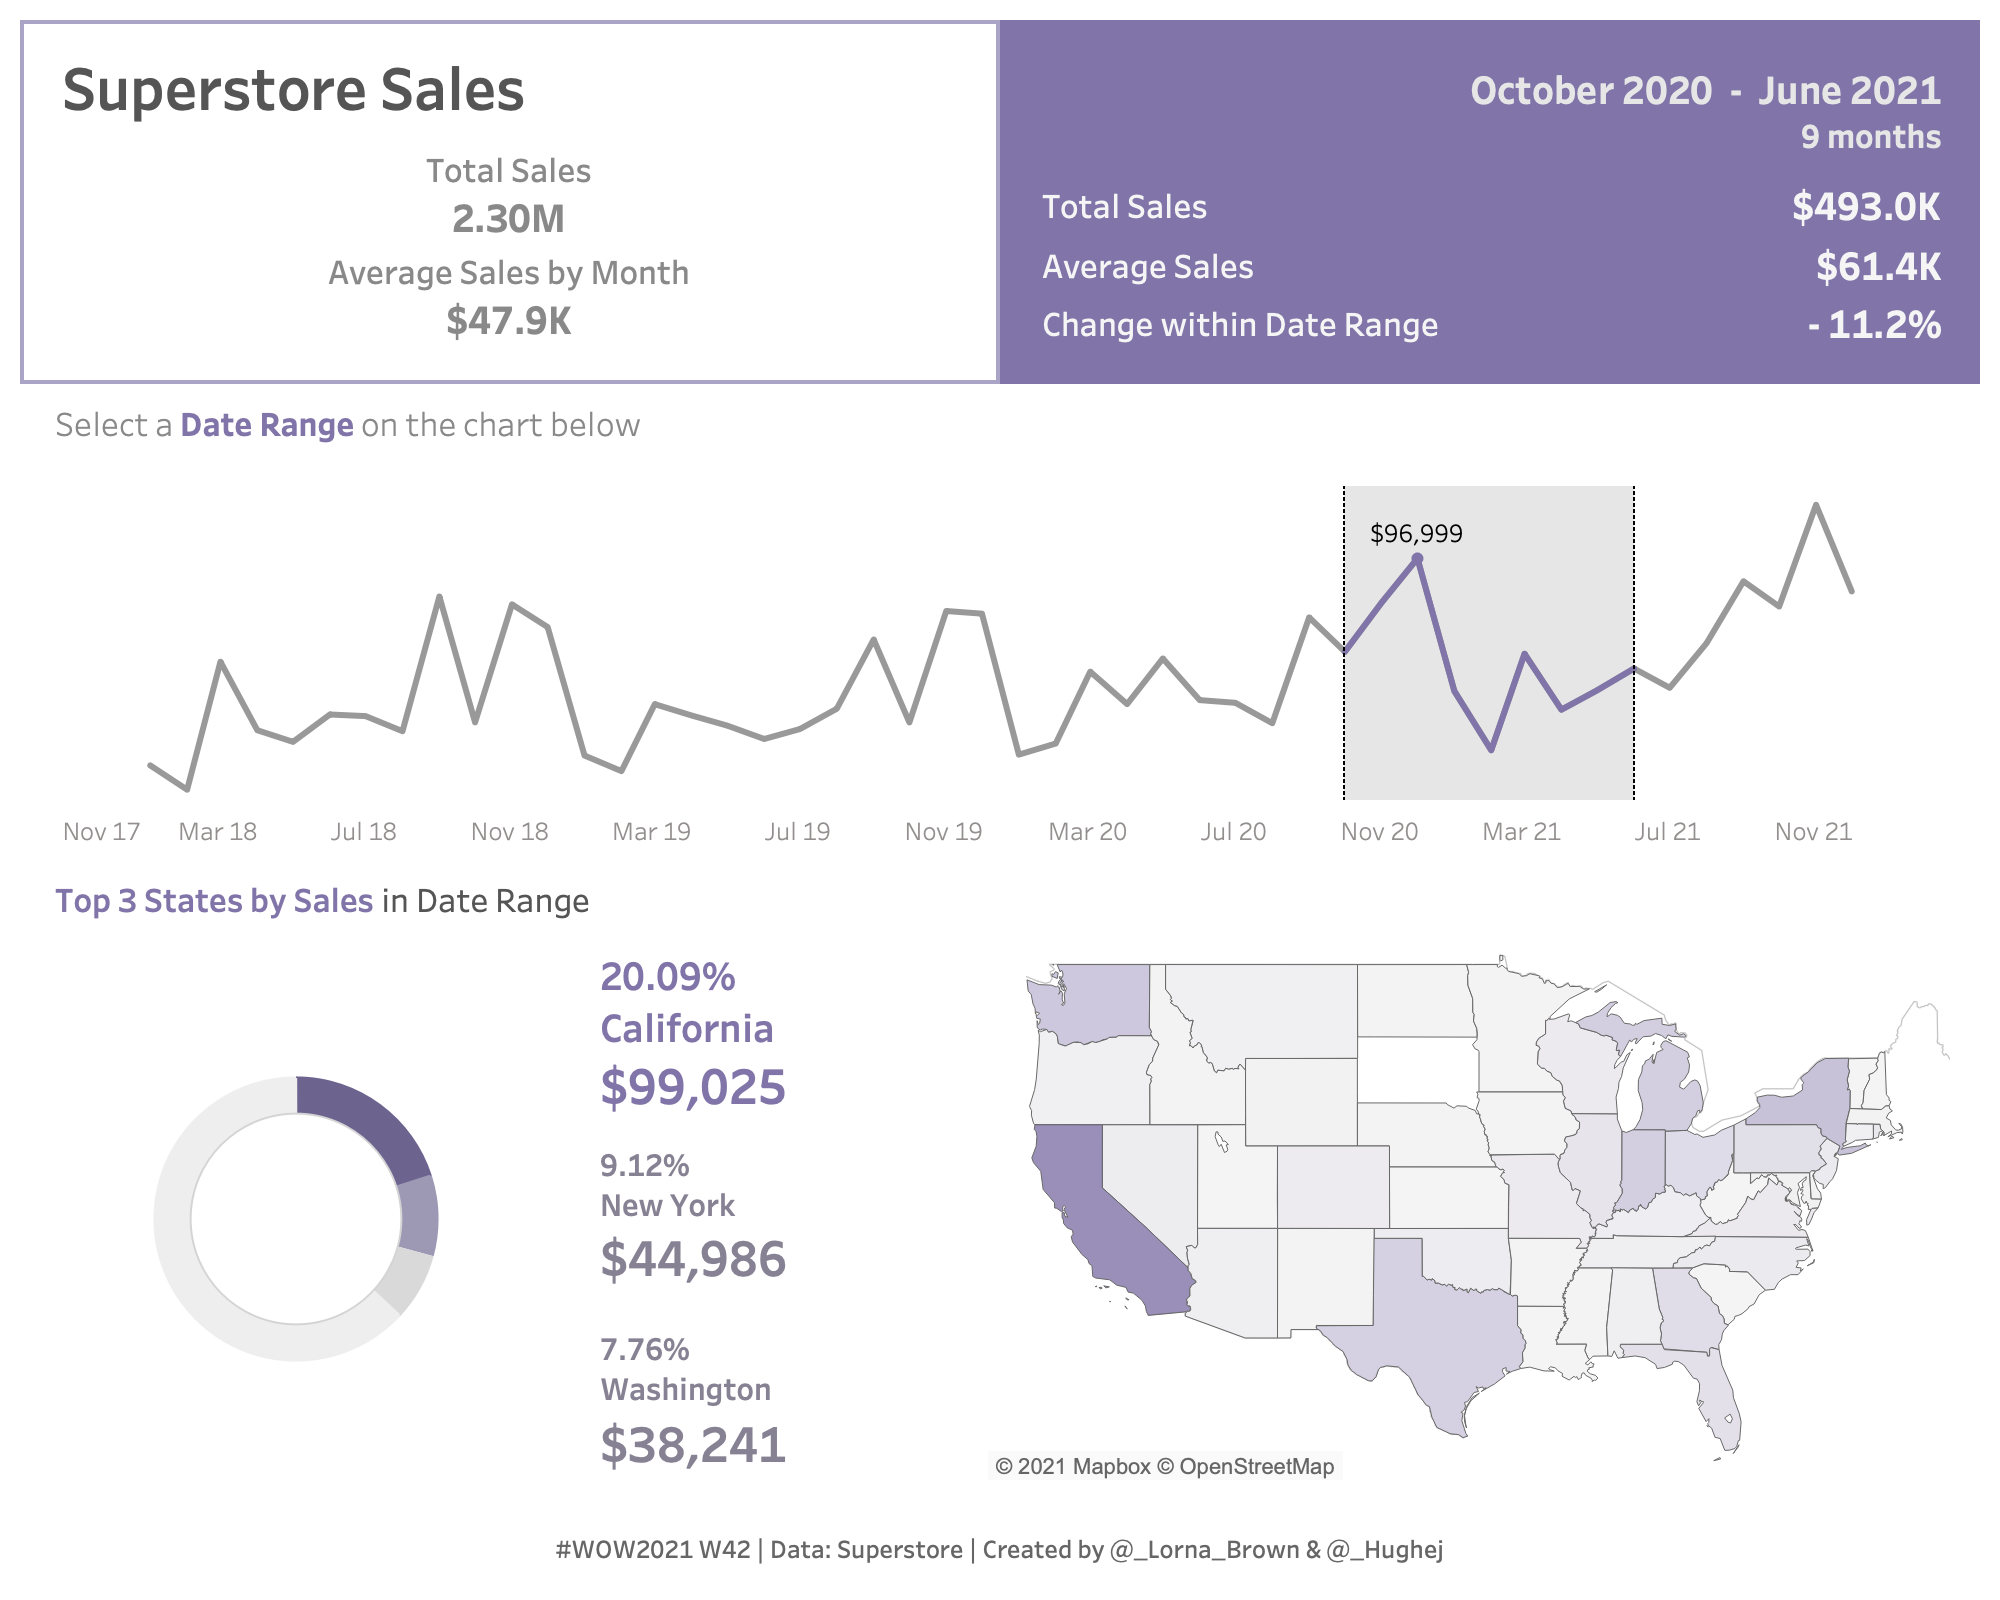
- Create a Line chart which has a selectable date range using SET ACTIONS ONLY! Which is shown with a reference band and different colour line.
- DO NOT USE FILTER ACTIONS
- Create BANS to show Total and Average Sales AND filtered to the selected date range
- Create a Top 3 States with % of Total and Donut Chart
- Along with a Map.
- Every chart apart from the TOTAL sales should be filterable by the date range!
- If you can create with Set Actions, then recreate with Parameter Actions.
Dataset
This week uses the superstore dataset for Tableau 2021.1. You can get it here at data.world
Attribute
When you publish your solution on Tableau Public make sure to take the time and include a link to the original inspiration. Also include the hashtag #WOW2021 in your description to make it searchable!

Share
After you finish your workout, share on Twitter using the hashtag #WOW2021 and tag @_HugheJ, @AnnUJackson, @ItsCandraM, @LukeStanke, @_Lorna_Brown and @HipsterVizNinja
