Introduction
I’ve heard last week’s challenge was a tough one, but it was great to see so many people participating and learning from it!
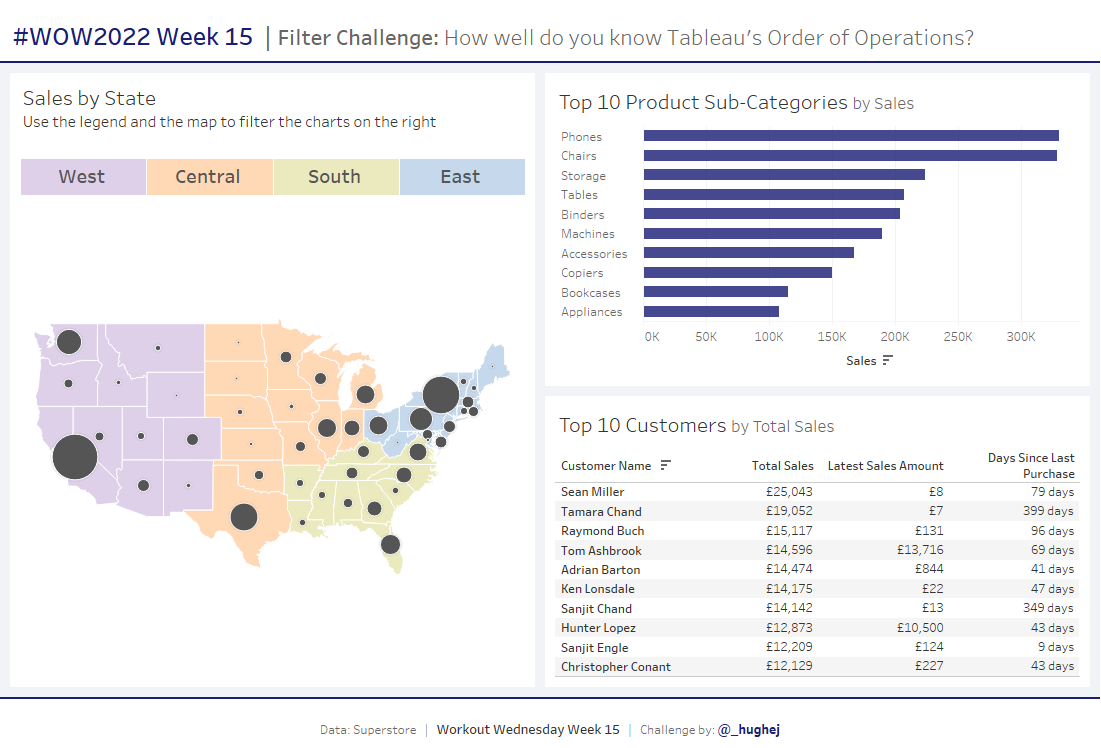
My challenge this week was inspired by a colleague at work. Without revealing too much, it has been designed to test your understanding of how filters work in Tableau, based on the Order of Operations.
For anyone looking to level up their skills, this is an essential concept to understand. For those of you who may be a bit more comfortable with your filters, there’s one small but trickier challenge for you to find.
Enjoy!
Requirements
- Dashboard Size: 1100 x 750px
- I used 4 sheets, you shouldn’t need more than that
CHARTS
- Map: colours States by Region and then has circles overlayed where the size represents the total Sales in each state.
- Bar chart: displays the Top 10 Sub-categories by Sales
- Table: displays the Top 10 Customers by Total Sales and also displays:
- The amount of Sales for their most recent order
- The number of days since their most recent order (compared to the Max Date in the dataset)
- Colour legend: create a custom colour legend for the map regions which can also act as a filter for the other charts.
FILTERS
- Enable the colour legend to filter all charts by Region.
- Enable the map to filter the Bar and Table by State.
- NOTE: The Top 10 lists must display the top values for the selected Region/State.
- Examples: the filters should allow you to answer questions like “What were the Top 10 Products sold in the state of New York?” or “Who were top Customers in the West region?”
Dataset
This week uses Tableau’s Sample Superstore data set. You can find it here on Data.World.
Attribute
When you publish your solution on Tableau Public make sure to take the time and include a link to the original inspiration. Also include the hashtag #WOW2022 in your description to make it searchable!

Share
After you finish your workout, share on Twitter using the hashtag #WOW2022 and tag @LukeStanke, @_Lorna_Brown, @HipsterVizNinja, @_hughej, and @YetterDataViz
