Introduction
Welcome to Week Eleven! This week, you’re going to learn about Sigma’s Subtotal, PercentOfTotal, and GrandTotal functions. I find these functions particularly useful in adding context to ToolTips or Pivot tables.
In this challenge, you will explore the various types of subtotaling functions. As you work through this challenge, think about the story the different formula modes tell, and exactly how they calculate the final result.
As a bonus, you will create a dynamic parameter page control to let users choose which type of Percent of Total they would like to analyze.
Good Luck!
-Ashley
Need access to Sigma?
Note: You will only have view access to WOW Workbooks, Folders, and Workspaces, not edit access. Please create your WOW Workbooks under “My Documents.” We suggest creating a folder to organize all your workbooks.

Requirements
- Add a data element from PLUGS_ELECTRONICS_HANDS_ON_LAB_DATA
- Sigma Sample Database > Retail > Plugs_Electronics
- Note that ‘Revenue’ is hiding in the ‘Metrics’ tab
- Filter this data element to the Current Quarter
- Convert this to a page control and place it on the visible tab for user interaction
- Hide the Data Tab
- On a visible page:
- Create a non-stacked Bar Graph:
- X-Axis: Store Region
- Y-Axis: Revenue metric
- Color: Product Type
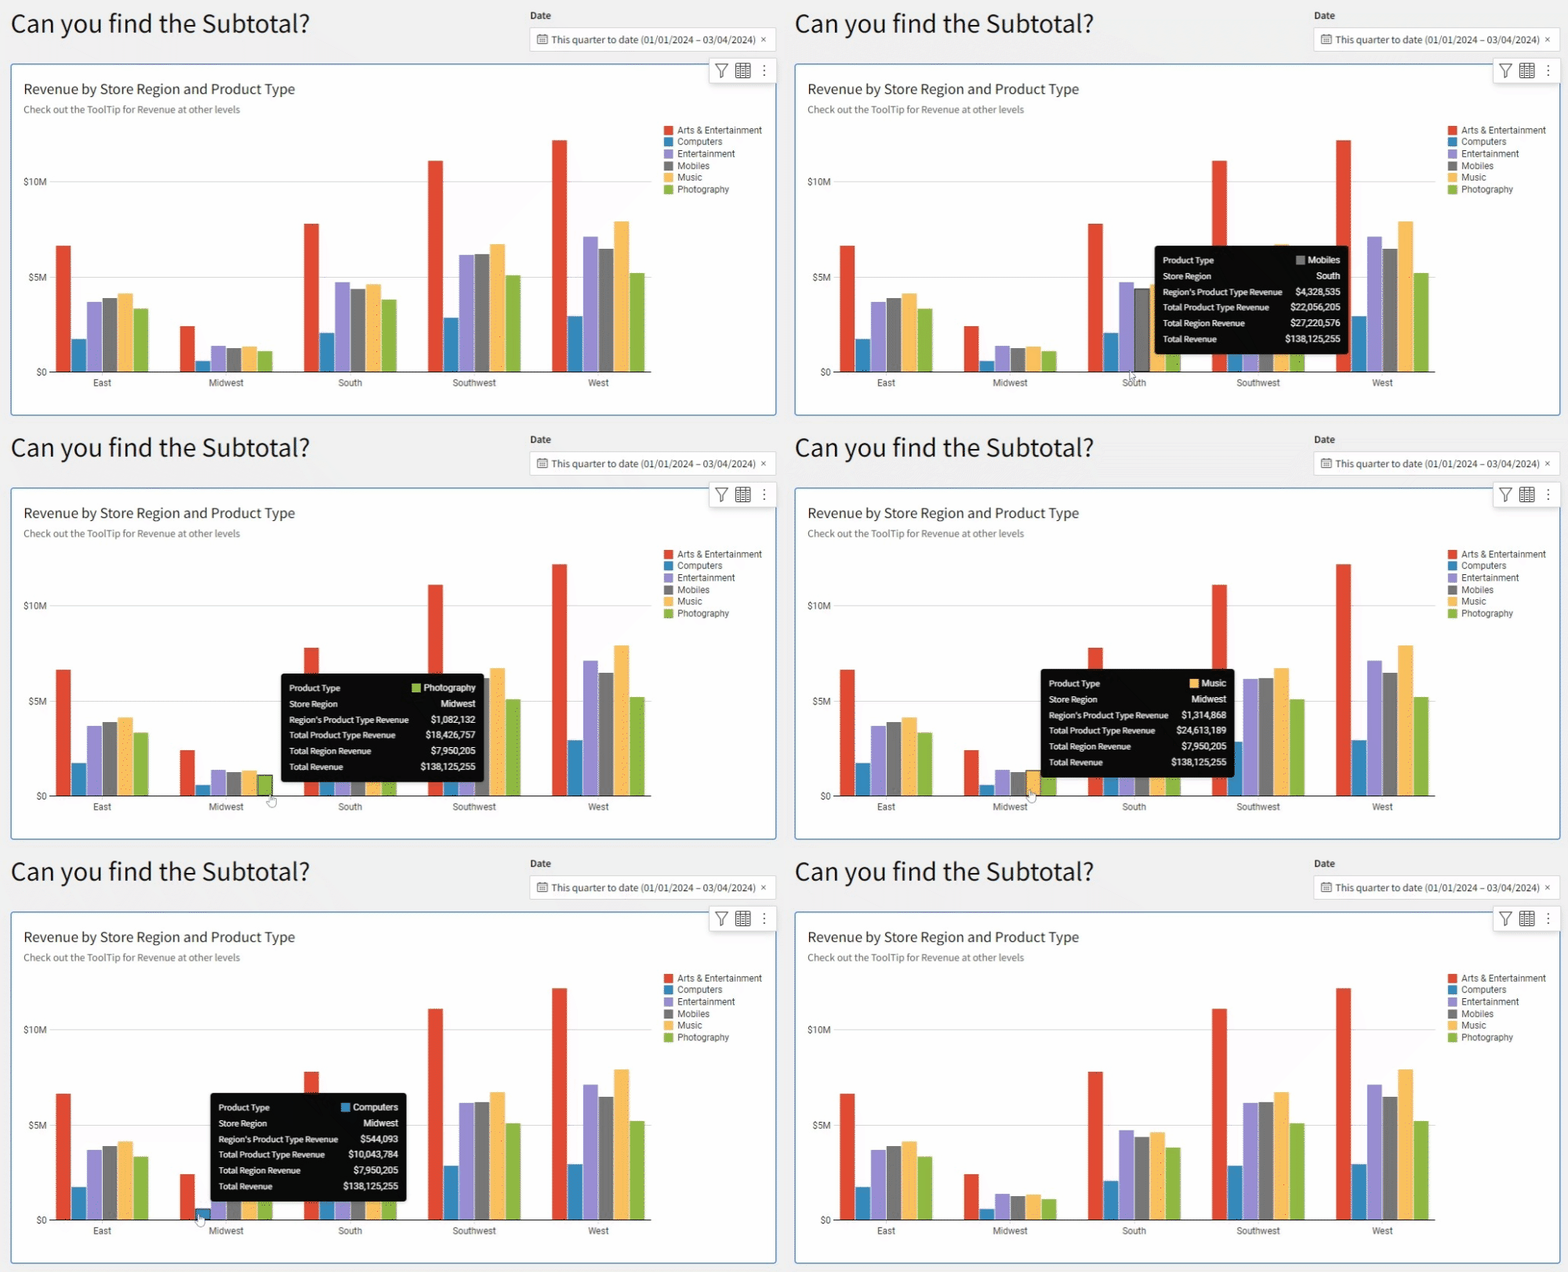
- Use the Subtotal and GrandTotal functions to create 3 new columns in the ToolTip:
- Total Product Type Revenue
- Total Region Revenue
- Total Revenue
- Formatting Requirements:
- The Y-Axis should be formatted to $ SI Units ($.2~s) and hidden from the ToolTip
- Utilize a 4th Custom ToolTip to display Revenue as Currency rounded to the nearest dollar
- Name this Region’s Product Type Revenue
- Order the Custom ToolTips so the Region’s Product Type Revenue (the smallest level) is listed first and the Total Revenue (the largest level) is listed last
- Round all ToolTips to the nearest dollar
- Add a chart description to alert the users that more information can be found in the ToolTip
- Change the Color Palette
- Set the Gap between sets to Medium
- Create a list page control where users can select an appropriate [Percent-Of-Total-Type]: column, row, or grand_total
- This control should be a required, single select control without a null option.
- Hint: The text value should be lowercase, as Sigma would expect in a PercentOfTotal function
- Give the Displayed Values names that clearly denote what the value will display (i.e. Product Type % of Region).
- Create a Pivot Table
- Pivot Rows: Product Type
- Pivot Columns: Store Region & Value Names
- Values:
- Revenue Metric
- % of Total: Utilize the PercentOfTotal function, the Revenue metric, and the input from the [Percent-Of-Total-Type] control
- Formatting:
- Give the Pivot Table a descriptive name
- Use the Presentation Table Style with all gridlines
- Make Grand Totals bold and filled gray
- Add Data Bars to % of Total:
- Change the Color to light blue
- Customize the Domain to show the value relative to 100%
- Create a non-stacked Bar Graph:
Dataset
Sigma Sample Database > Retail > Plugs_Electronics > PLUGS_ELECTRONICS_HANDS_ON_LAB_DATA
Share
After you finish your workout, share on LinkedIn, Sigma’s Community page, (or Twitter) using the hashtags #WOW2024 and #SigmaComputing, and tag Ashley Bennett, Eric Heidbreder, and Katrina Menne!
Also, make sure to fill out the Submission Tracker so that we can count you as a participant this week to track our participation throughout the year.