Introduction
Welcome to Week 18!
This week we’ll be consolidating menu item data and sales data from Sigma’s sample food trucks database using a powerful tool – Joins! We’ll use both Joins and Lookups to get a feel of the difference between the two.
The formatting styles and colors in this challenge are all up to you. Try to make the report easy to read, with the important data popping!
If you’d like to learn more about different types of joins before you begin, read Sigma’s documentation page on Lookups and Joins.
Have fun!
Need access to Sigma?
Note: You will only have view access to WOW Workbooks, Folders, and Workspaces, not edit access. Please create your WOW Workbooks under “My Documents.” We suggest creating a folder to organize all your workbooks.

Requirements
- Add four data table element from TASTY_BYTES_FOOD_TRUCKS schema
- Sigma Sample Database > Retail > TASTY_BYTES_FOOD_TRUCKS
- TRUCKS – has truck information
- FRANCHISE – has information on franchise owners
- MENU_ITEM – has data on the menu items served
- FCT_ORDERS – has order information by truck and menu item
- Sigma Sample Database > Retail > TASTY_BYTES_FOOD_TRUCKS
- In the FRANCHISE table, create a new column with the full name of the franchise owner. (Hint: use the concat function).
- Use lookups to get the franchise owner full name into the FCT_ORDERS table.
- Add the Franchise ID from the TRUCKS table into the FCT_ORDERS table
- Add the Franchise owner full name from the FRANCHISE table into the FCT_ORDERS table
- Group the MENU_ITEM table
- First grouping level – Truck Brand Name, Menu Type
- Second grouping level – Item Category
- Third grouping level – Menu Item ID, Menu Item Name, Cost, Price
- Format values in currency or number as needed
- Group the FCT_ORDERS table
- First add a calculated column to get the % of total order amount spent on the menu item.
- First grouping level – Truck Brand Name, Truck ID, Franchise Owner Full Name
- Second grouping level – Menu Item ID, total orders, total quantity sold, total price, average percent of total order (hint: use sum() and avg() aggregations)
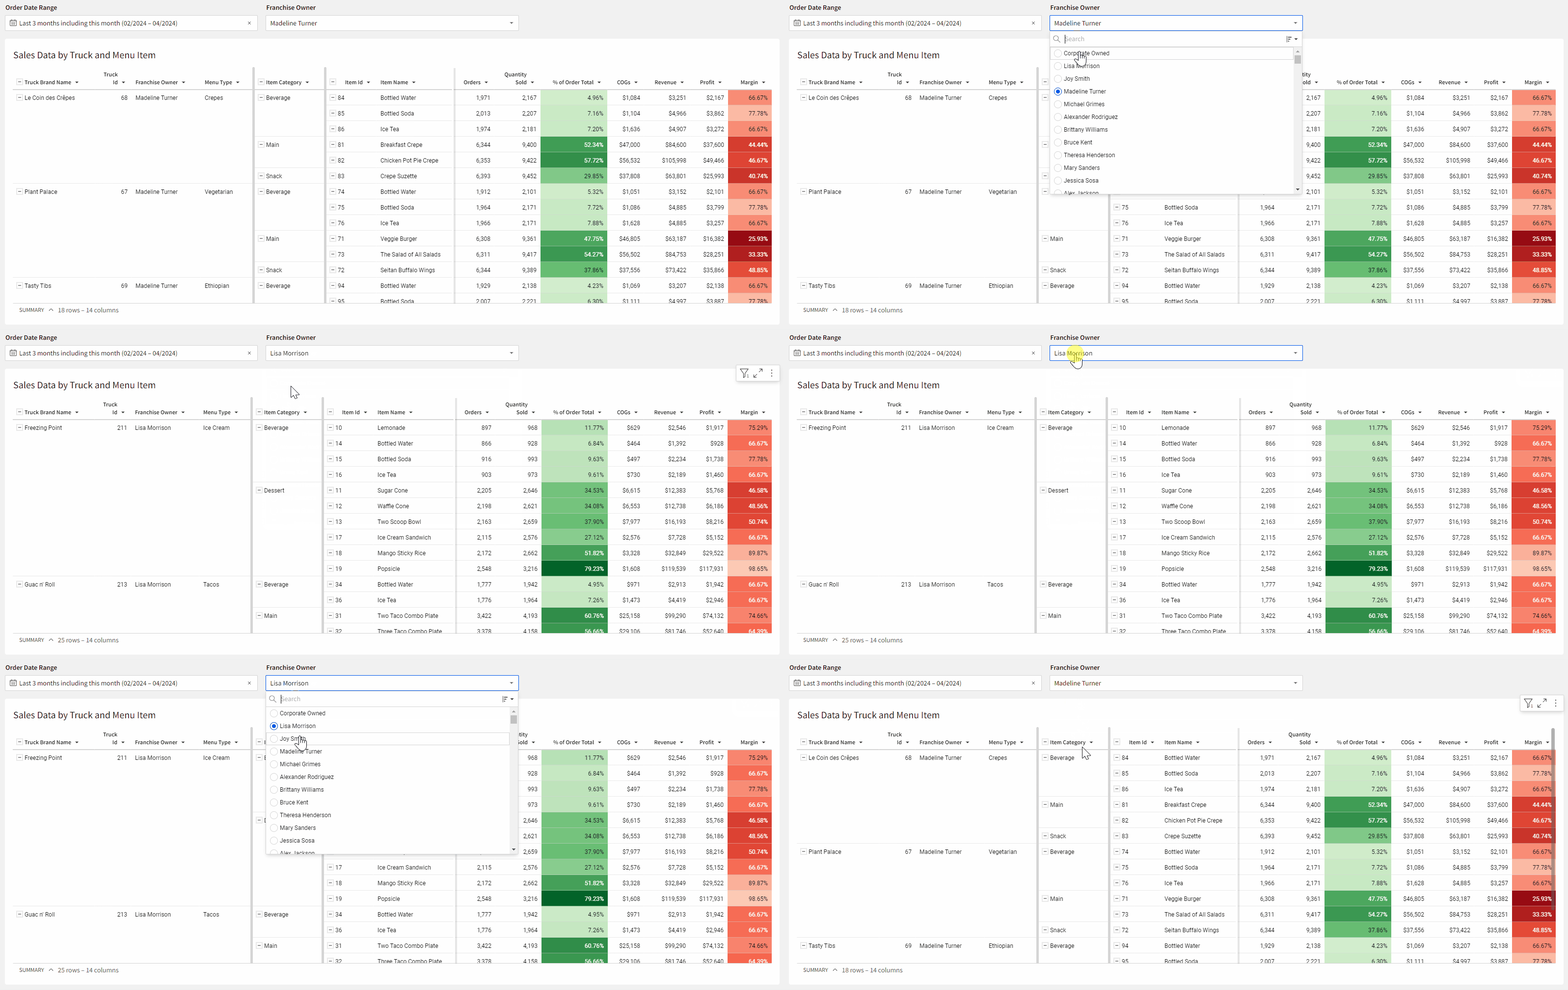
- Add a page control to filter the order dates on the FCT_ORDERS table
- Join the MENU_ITEM and FCT_ORDERS tables
- Use a left join, with the MENU_ITEM on the left and FCT_ORDERS on the right of the join. (hint: be careful with the join grouping levels! You want to keep the groupings we created, but you don’t want the extra columns that we didn’t add into our groupings.)
- Re-Group the data in your new joined table
- First Grouping level: Truck Brand, Truck ID, Owner, Menu Type
- Second Grouping level: Category
- Third Grouping Level: Item ID, Item Name
- Calculate additional metrics
- Calculate total cost (hint: use the cost per item and the total quantity sold)
- Calculate Profit (hint: Revenue – Cost)
- Calculate Margin (hint: Profit/Revenue)
- Rename columns for clarity and hide unnecessary columns
- Use conditional formatting to make the important columns stand out
- Add a color scale to % of total order amount – higher is better (we want high to stand out)
- Add a color scale to Margin – higher is better (we want low to stand out)
- Add a single-select control for Franchise Owner
- Move your joined table and controls to a new page, hide the data page, and format the table style to your liking.
Dataset
Sigma Sample Database > Retail > TASTY_BYTES_FOOD_TRUCKS
Share
After you finish your workout, share on LinkedIn, Sigma’s Community page, (or Twitter) using the hashtags #WOW2024 and #SigmaComputing, and tag Ashley Bennett, Eric Heidbreder, Katrina Menne, and Michal Shaffer!
Create an interactive, sharable version of your solution here.
Also, make sure to fill out the Submission Tracker so that we can count you as a participant this week to track our participation throughout the year.