Introduction
Welcome to Week 22!
This week we’ll be using the food truck data set again. We’ll use Input tables to set profit goals, and get a powerful view of how our actual sales perform against our goals!
If you need a refresher on input tables, revisit week 6’s challenge, or read up on them in Sigma’s documentation.
The formatting styles and colors in this challenge are all up to you. Try to make the report easy to read, with the important data popping!
Have fun!
Need access to Sigma?
Note: You will only have view access to WOW Workbooks, Folders, and Workspaces, not edit access. Please create your WOW Workbooks under “My Documents.” We suggest creating a folder to organize all your workbooks.

Requirements
- [If you have completed week 18’s challenge you can use your existing workbook data and skip the next two points.]
- Add data table element from TASTY_BYTES_FOOD_TRUCKS schema
- Sigma Sample Database > Retail > TASTY_BYTES_FOOD_TRUCKS
- TRUCKS – has truck information
- FRANCHISE – has information on franchise owners
- Sigma Sample Database > Retail > TASTY_BYTES_FOOD_TRUCKS
- In the FRANCHISE table, create a new column with the full name of the franchise owners.
- Use a lookup to get the franchise owner full name into the TRUCKS table.
- Add data table element
- FCT_DAILY_ORDER_PROFIT – has daily order information
- Use a lookup to get the franchise owner full name in to the FCT_DAILY_ORDER_PROFIT table from the TRUCKS table.
- Group the FCT_DAILY_ORDER_PROFIT table
- First grouping level – Truck Brand Name, Truck ID, Franchise Owner Full Name
- Second grouping level – Month of Order Date
- Calculations – Total Sales, Total COGs, Total Profit
- Add a page control for order date (set to last 3 months) and Franchise owner (no multiple selection, set to any franchise owner).
- Create a linked input table
- Use columns Truck ID and Order Month as the unique row identifiers.
- Add the column Total Profit (not as a unique identifier).
- Create a numeric column called ‘Manual Profit Goals’ and add some dummy goals into a few cells.
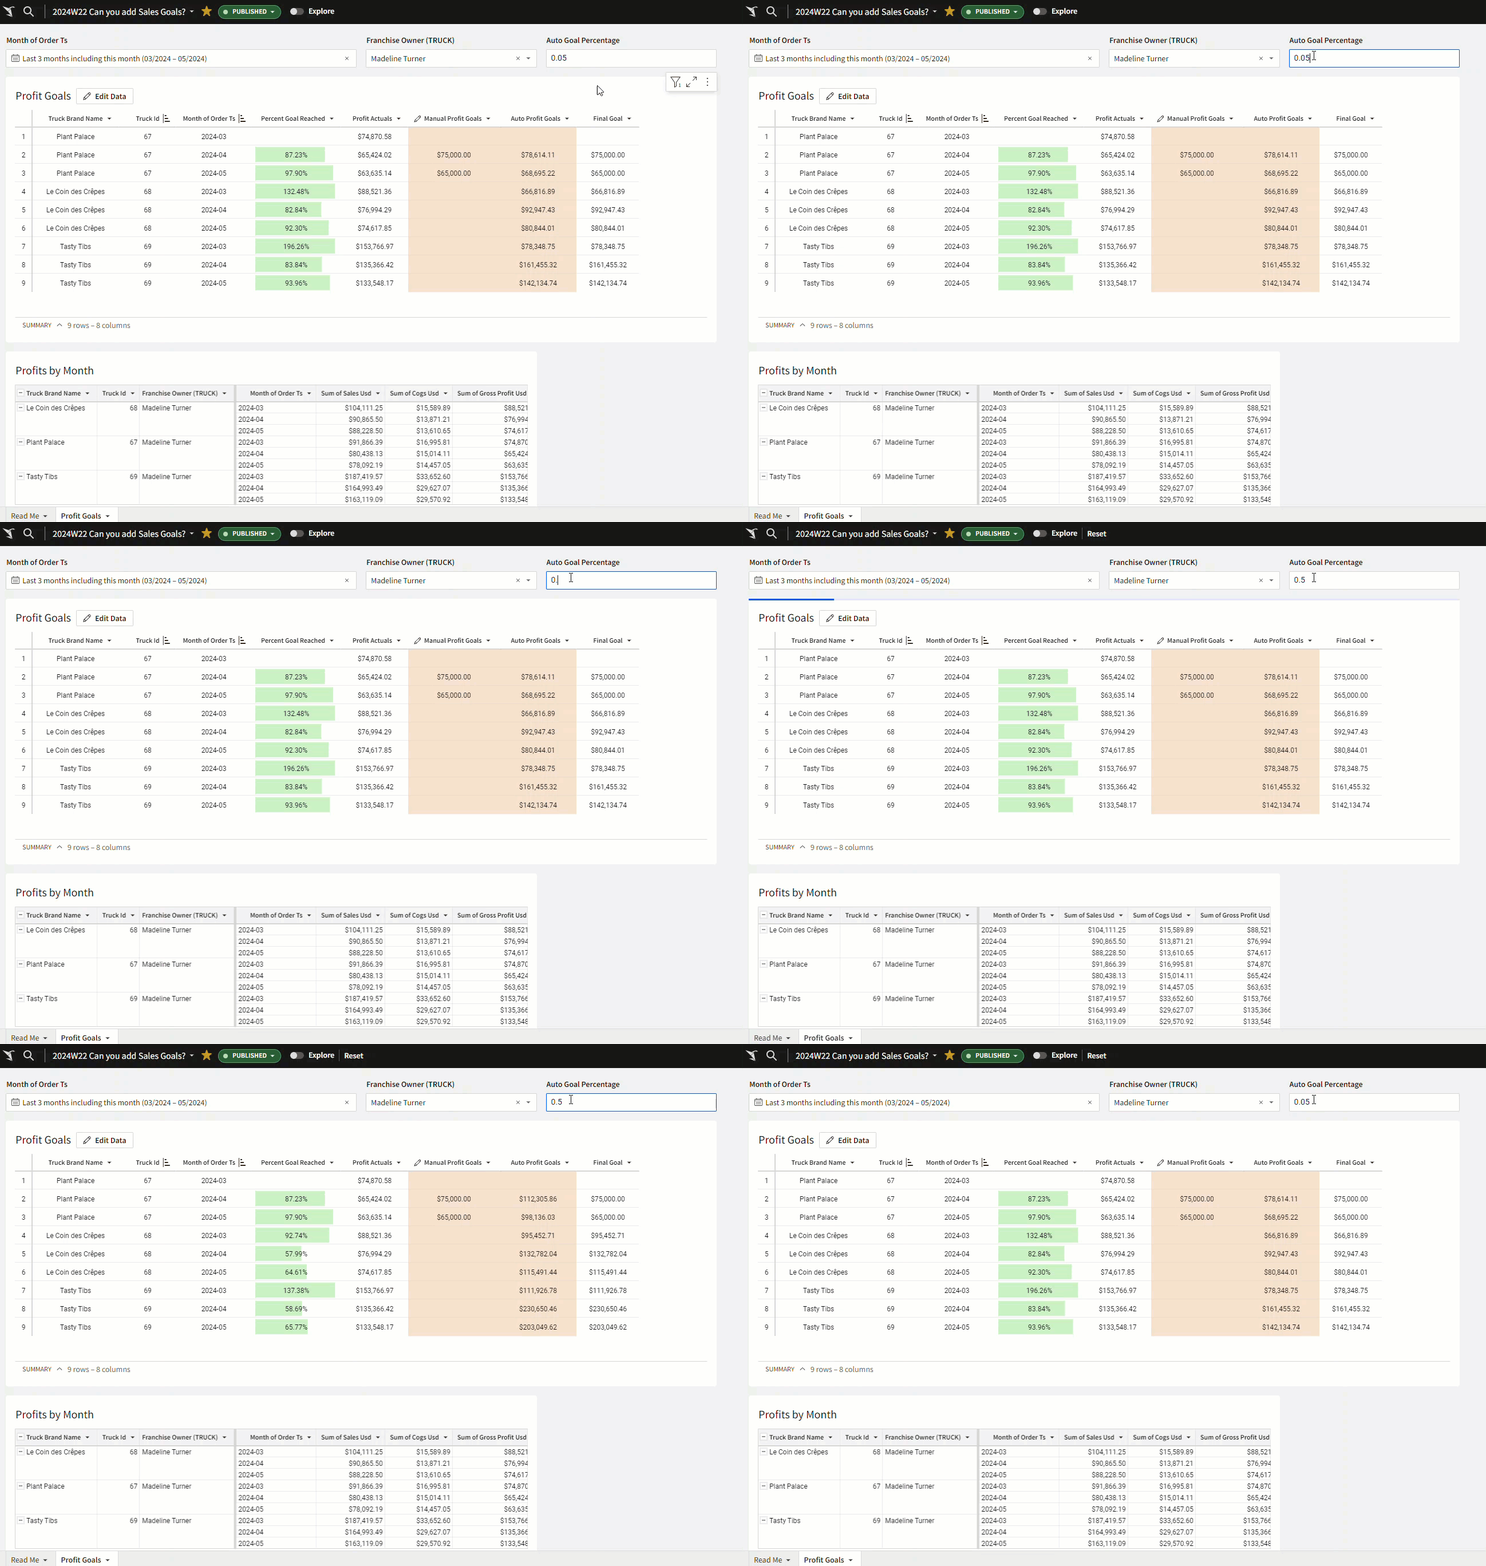
- Create a calculated column called ‘Auto Profit Goals’ using a 10% increase on the previous month’s total profit. (hint: create a new column as a ‘calculation’ column type, and use the lag() function on the total profit column).
- Create a number input control called ‘Auto Profit Percentage Increase’
- Update the Auto Profit Goals formula to include the input control instead of the hard set 10% increase.
- Add a calculation column to populate the Final Goal as follows: if there is a manual goal, use the manual goal. Otherwise use the Auto Goal. (hint: use the coalesce function.)
- Add a calculation column to calculate the percentage of the final goal reached. (hint: total profit / final goal)
- Add conditional formatting to the percentage of final goal reached column to show data bars, with the max value of 100%.
- Change your input table data-entry permissions to “Only on Published version”.
- Format your columns, move the percentage of final goal reached to the front of the table, and set your table style to your preference.
- Note: You may notice that the auto goals are calculated based on the previous column, regardless of which truck ID or truck brand name it is. This happens because the input table cannot be grouped. Next time we will recreate this input table as well as a new child element to get more accurate results! Stay Tuned 😀
Dataset
Sigma Sample Database > Retail > TASTY_BYTES_FOOD_TRUCKS
Share
After you finish your workout, share on LinkedIn, Sigma’s Community page, (or Twitter) using the hashtags #WOW2024 and #SigmaComputing, and tag Ashley Bennett, Eric Heidbreder, Katrina Menne, and Michal Shaffer!
Create an interactive, sharable version of your solution here.
Also, make sure to fill out the Submission Tracker so that we can count you as a participant this week to track our participation throughout the year.