Introduction
Welcome to Week 38!
Sometimes there are events or notable data points that aren’t stored in your data, but you want to see how they effect the trends. Enter reference marks and conditional formatting! This week we practice using reference marks and conditional formatting to highlight specific dates and events.
The formatting styles and colors in this challenge are all up to you. Try to make the report easy to read, with the important data popping!
Have fun!
Need access to Sigma?
Note: You will only have view access to WOW Workbooks, Folders, and Workspaces, not edit access. Please create your WOW Workbooks under “My Documents.” We suggest creating a folder to organize all your workbooks.

Requirements
Adding Data
- Add data table element from TASTY_BYTES_FOOD_TRUCKS schema
- Sigma Sample Database > Retail > TASTY_BYTES_FOOD_TRUCKS
- FCT_DAILY_ORDER_PROFIT – has daily order information
- Create a child element with the Order date, Total Sales, Total COGs, Total Profit, and Total Margin (you may have to recalculate margin, as Profit/Sales).
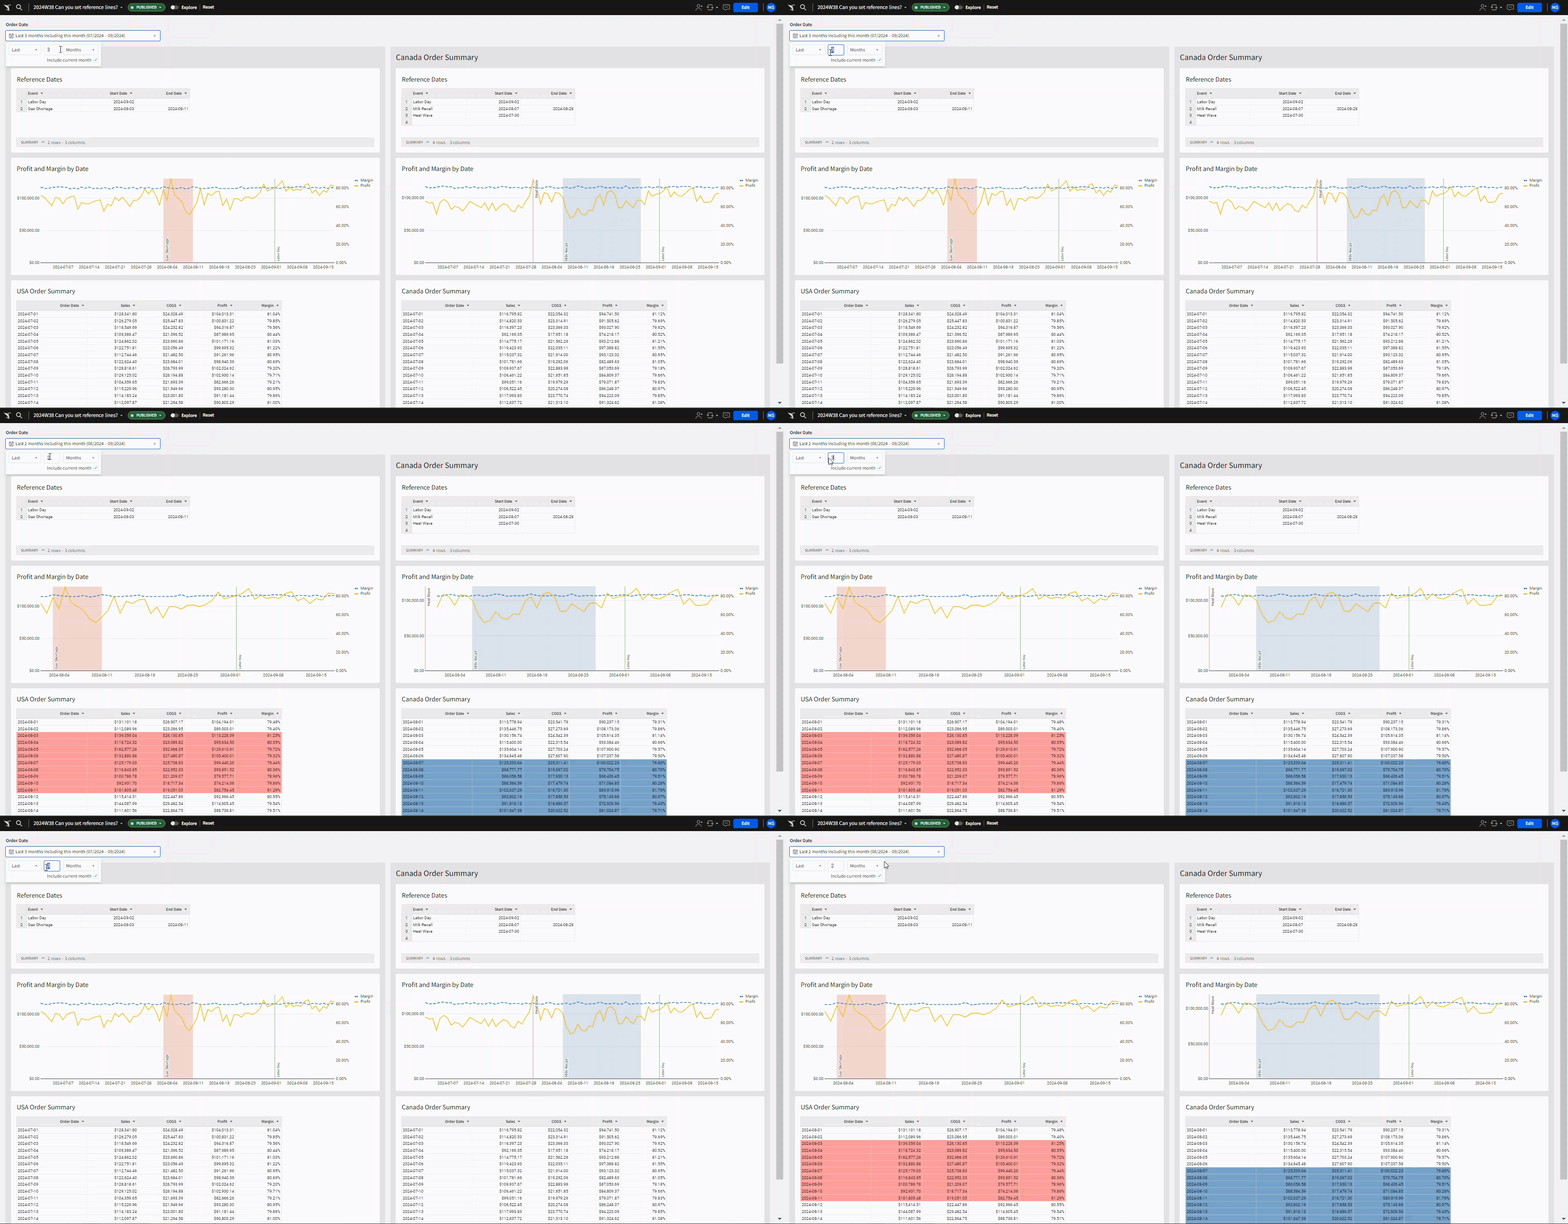
- Filter your table to US orders, and create a page control to filter the Order Date. Default to the last 3 months.
- Name your table USA Order Summary
- Create a line chart called Profit and Margin by Date, showing Profit over time and Margin over time. Make sure Margin is the right Y-axis, and format it to be a dashed line.
- Create an input table with columns Event, Start Date, End Date.
Labor Day 2024-09-02 Gas Shortage 2024-08-03 2024-08-11 - Add conditional formatting to your table:
- using a custom formula check if the order date is equal to the start date of the Labor Day event, and set the background color to green.
- repeat for order dates between the Gas Shortage dates, and use background color red.
- Add a reference mark to your line chart:
- Add a Constant line on the X-Axis, set to the start date of Labor Day, and use the Label ‘Labor Day’ positioned on the bottom right. Set the line color to green.
- Add a Constant Band on the X-Axis, with the band start and band end set to the dates of the Gas Shortage, add a label positioned on the bottom right and set the color to red.
- Arrange your three tables stacked on top of each other and put them into a single container.
- Duplicate the entire container
- Filter the Order Summary table to Canada instead of US
- Change the input table to the following Events:
- Add data table element from TASTY_BYTES_FOOD_TRUCKS schema
| Labor Day | 2024-09-02 | |
| Milk Recall | 2024-08-07 | 2024-08-28 |
| Heat Wave | 2024-07-30 |
- Update the conditional formatting in your summary table to use the new events.
- Update the reference marks in the line chart to the use the new events.
- Put the containers side by side, add any additional formatting you’d like, and don’t forget to share your solution!
Dataset
Sigma Sample Database > Retail > TASTY_BYTES_FOOD_TRUCKS
Share
After you finish your workout, share on LinkedIn, Sigma’s Community page, (or Twitter) using the hashtags #WOW2024 and #SigmaComputing, and tag Ashley Bennett, Eric Heidbreder, Katrina Menne, and Michal Shaffer!
Create an interactive, sharable version of your solution here.
Also, make sure to fill out the Submission Tracker so that we can count you as a participant this week to track our participation throughout the year.