Introduction
It’s the last challenge of 2024! Whether you’ve been with us all year or are joining us for the first time, welcome!
With the holiday season in full swing, we are keeping it light this week. We’re going to analyze some holiday movie data that I sourced from Kaggle. This dataset found movies on IMDB containing “holiday”, “Christmas”, “Hanukkah”, or “Kwanzaa” in the title.
We’re going to utilize some of my favorite elements of Sigma: KPI Charts, Containers, and advanced filtering techniques.
Good Luck and Happy Holidays!
-Ashley
Need access to Sigma?
Note: You will only have view access to WOW Workbooks, Folders, and Workspaces, not edit access. Please create your WOW Workbooks under “My Documents.” We suggest creating a folder to organize all your workbooks.
Requirements
- On a hidden Data Tab:
- First, we want to add our two Data Models. These can be found in the same document: Workspaces / Workout Wednesday / 2024 / 2024W52 – Holiday Movies
- The Holiday Movies data model is all of our data at the movie granularity.
- Note the metrics that we will be using:
- Count of Movies: Count()
- Average Rating: Avg([Rating])
- Total Minutes: Sum([Runtime (Minutes)]
- Total Votes: Sum([Votes])
- For our KPI Trendlines, we need a column where the year is converted to a date type column. Add a new column that Makes a Date out of the Year column.
- Note the metrics that we will be using:
- The Holiday Movies Grouped by Genre is that same data at the movie and genre granularity. Because a movie can have multiple genres, this table is fanned quite a bit from the original dataset. We will use it to analyze individual genre types in our bar graph
- Note the metrics that we will be using:
- Count of Movies: CountDistinct([Movie ID])
- Average Rating: Avg([Rating])
- Total Votes: Sum([Votes])
- Note the metrics that we will be using:
- The Holiday Movies data model is all of our data at the movie granularity.
- First, we want to add our two Data Models. These can be found in the same document: Workspaces / Workout Wednesday / 2024 / 2024W52 – Holiday Movies
- On a visible tab:
- Create a Segmented Page control:
- Use a Manual list Value Source that allows users to choose between:
- Average Rating
- Count of Movies
- Total Minutes
- Total Votes
- Be sure to Display user-friendly options and note which values Sigma will respond to
- Do not show the clear option
- Give this control a descriptive name
- Right align this control
- Use a Manual list Value Source that allows users to choose between:
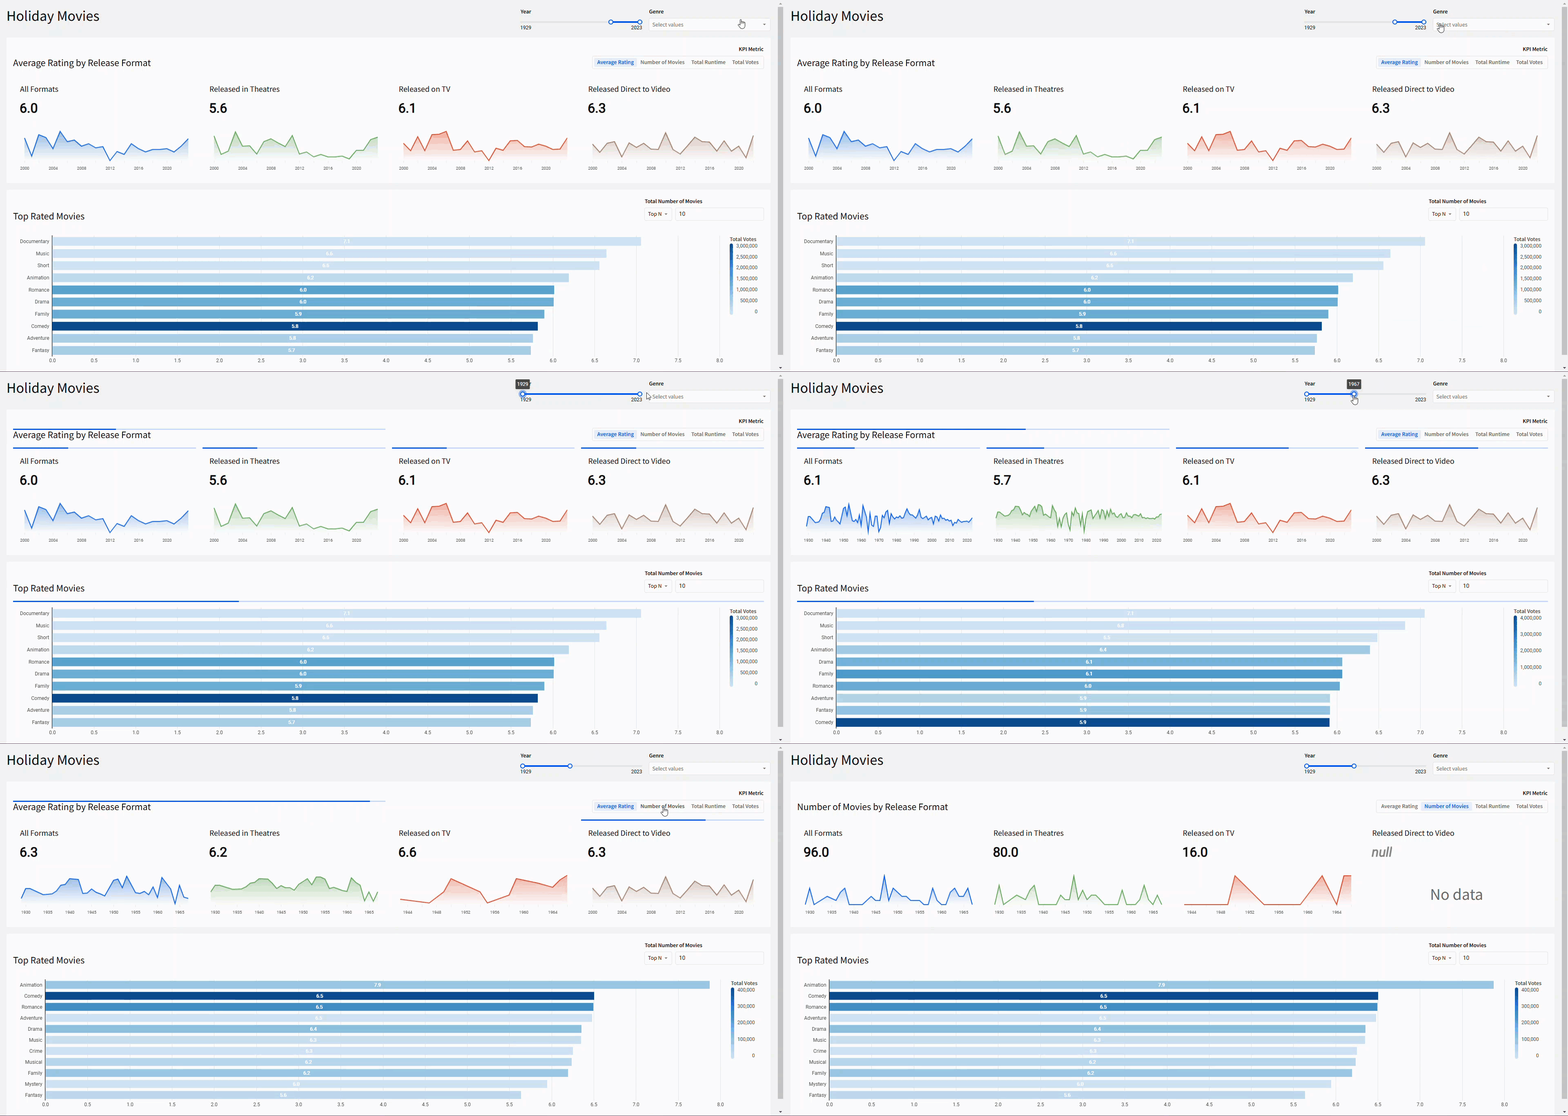
- Create a KPI chart, using the Holiday Movies source table:
- Value: Create a calculated column that shows the Selected Metric from the above page control. Format this column to Number and show one decimal place
- Timeline: The calculated Year as Date column, truncated to Year
- Comparison: Previous Year
- Default display type: Global
- Trend:
- Show the Tooltip and Timeline Axis
- Title this chart “All Formats”
- We want to analyze the different release formats at the same time, so now duplicate the KPI chart 3 times.
- In each new KPI, add a filter on [Movie Type], and select 1. There are 3 possible types:
- Movie: Released in Theatres
- TV: Released on TV
- Video: Released Direct to Video
- Be sure to change the title to denote which type each KPI is filtered to
- In each new KPI, add a filter on [Movie Type], and select 1. There are 3 possible types:
- Add these 4 KPI charts and the page control to a new container
- Add a dynamic text field that states the “[Selected Metric Name] by Release Format”
- Create a Segmented Page control:
- In a 2nd container:
- Create a horizontal stacked bar graph, using Holiday Movies Grouped by Genre as its source table:
- In a 2nd container:
- Y-Axis: Genre, sorted by Average Rating
- X-Axis:
- Average Rating (visible)
- Count of Movies (hidden)
- Color by Scale: Total Votes
- Filter to Top 10 [Count of Movies]
- Convert this filter to a page control inside this container and give a descriptive title
- Show Data Labels
- Show the Legend Header
- Hide the title
- Add a text box to title the container “Top Rated Movies”
- Note: I chose to hide the graph’s title and manually add a text box title because it looks nicer inside the container.
- Finishing Touches
- Add page-level filters, outside of both containers:
- Year
- Target the Number Year column in both source tables
- Range Slider
- Min = first possible year
- Max = last possible year
- Note: You can use Column Details to find these values
- Genre
- List Type
- Target only the Holiday Movies Grouped by Genre source table.
- Do not show the null option
- In the Holiday Movies source table, add a new column to determine which rows are [In Genre Filter?]
- Use Sigma functions to determine where the Genre Filter and the [Genre Array] intersect. If no value is selected in the filter, all rows should show.
- Year
- Give the dashboard a descriptive title
- Arrange your elements into a cohesive dashboard
- Add page-level filters, outside of both containers:
Dataset
Workspaces / Workout Wednesday / 2024 / 2024W52 – Holiday Movies
Share
After you finish your workout, share on LinkedIn, Sigma’s Community page, (or Twitter) using the hashtags #WOW2024 and #SigmaComputing, and tag Ashley Bennett, Eric Heidbreder, Katrina Menne, and Michal Shaffer!
Create an interactive, sharable version of your solution here.
Also, make sure to fill out the Submission Tracker so that we can count you as a participant this week to track our participation throughout the year.
