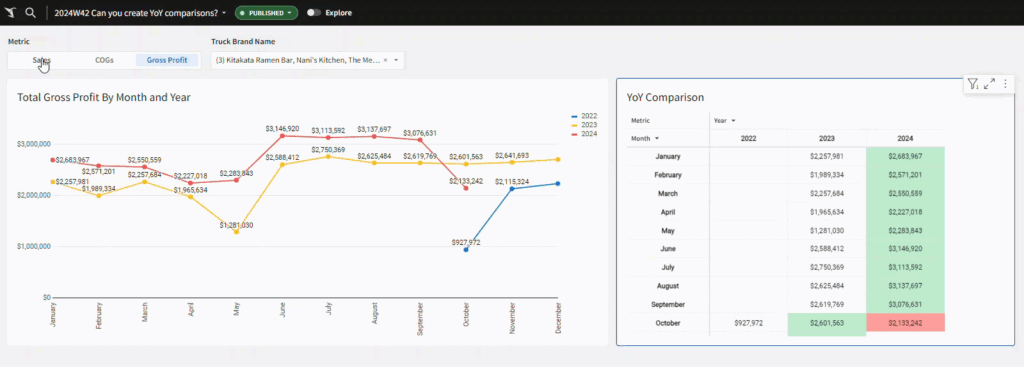
2024 Week 42 | Sigma: Can you compare Year over Year Data?
Introduction Welcome to Week 42! This week we’ll look at an easy way to compare data year over year, whether we are using a line chart visualization or a pivot table to view our data. There are many ways to acheive similar results, this is just one! Feel free to play around with other ways […]
2024 Week 42 | Sigma: Can you compare Year over Year Data? Read More »
