Introduction
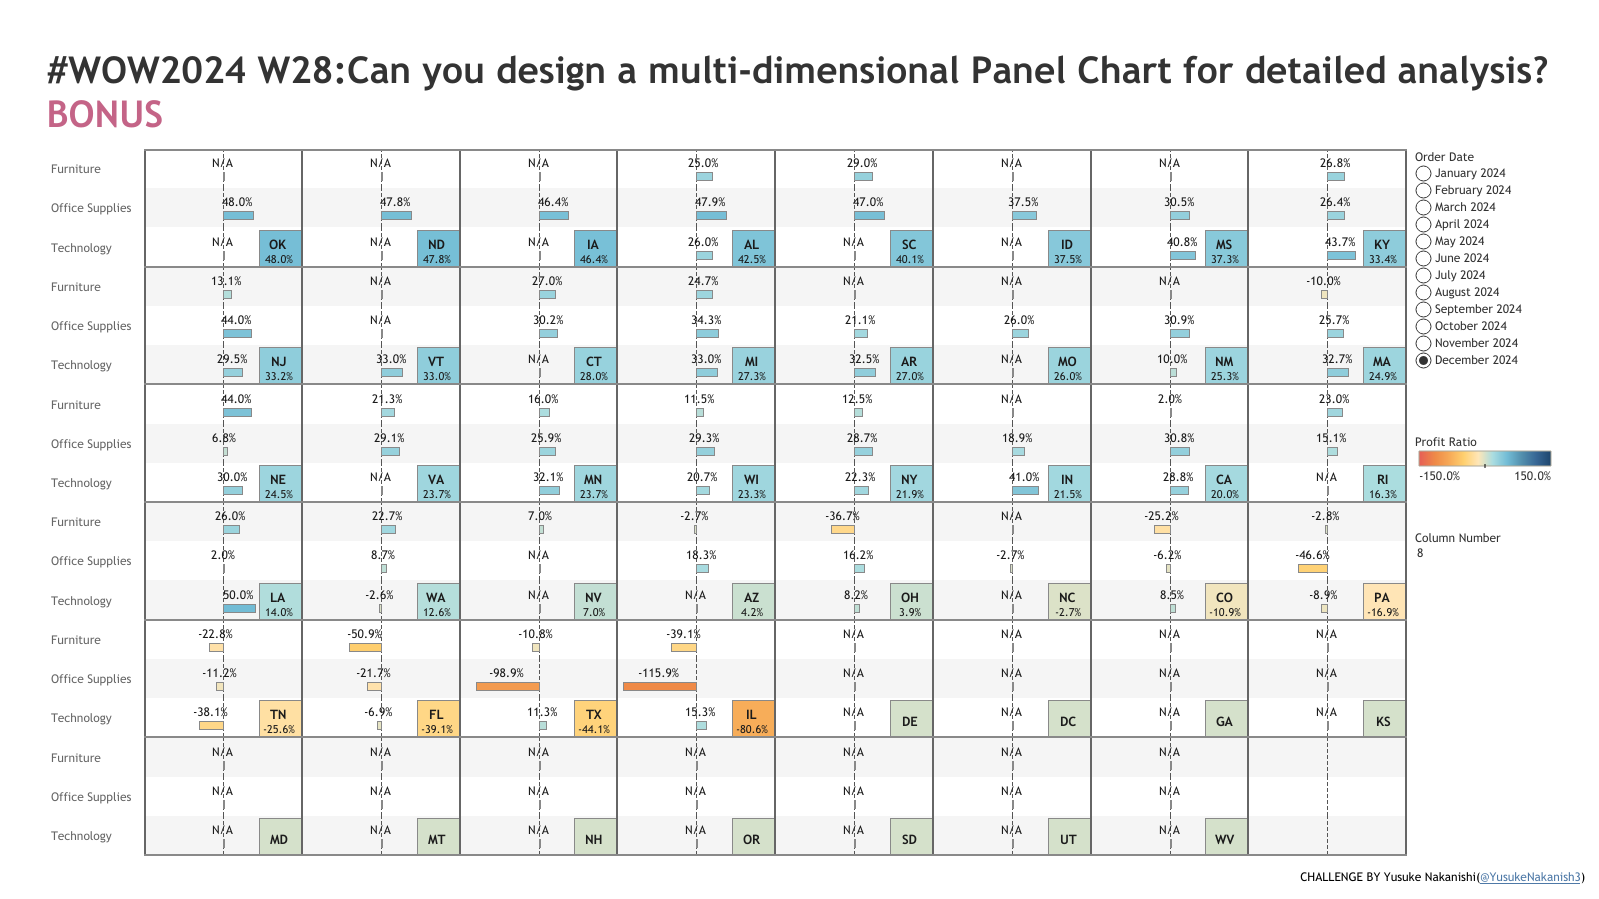
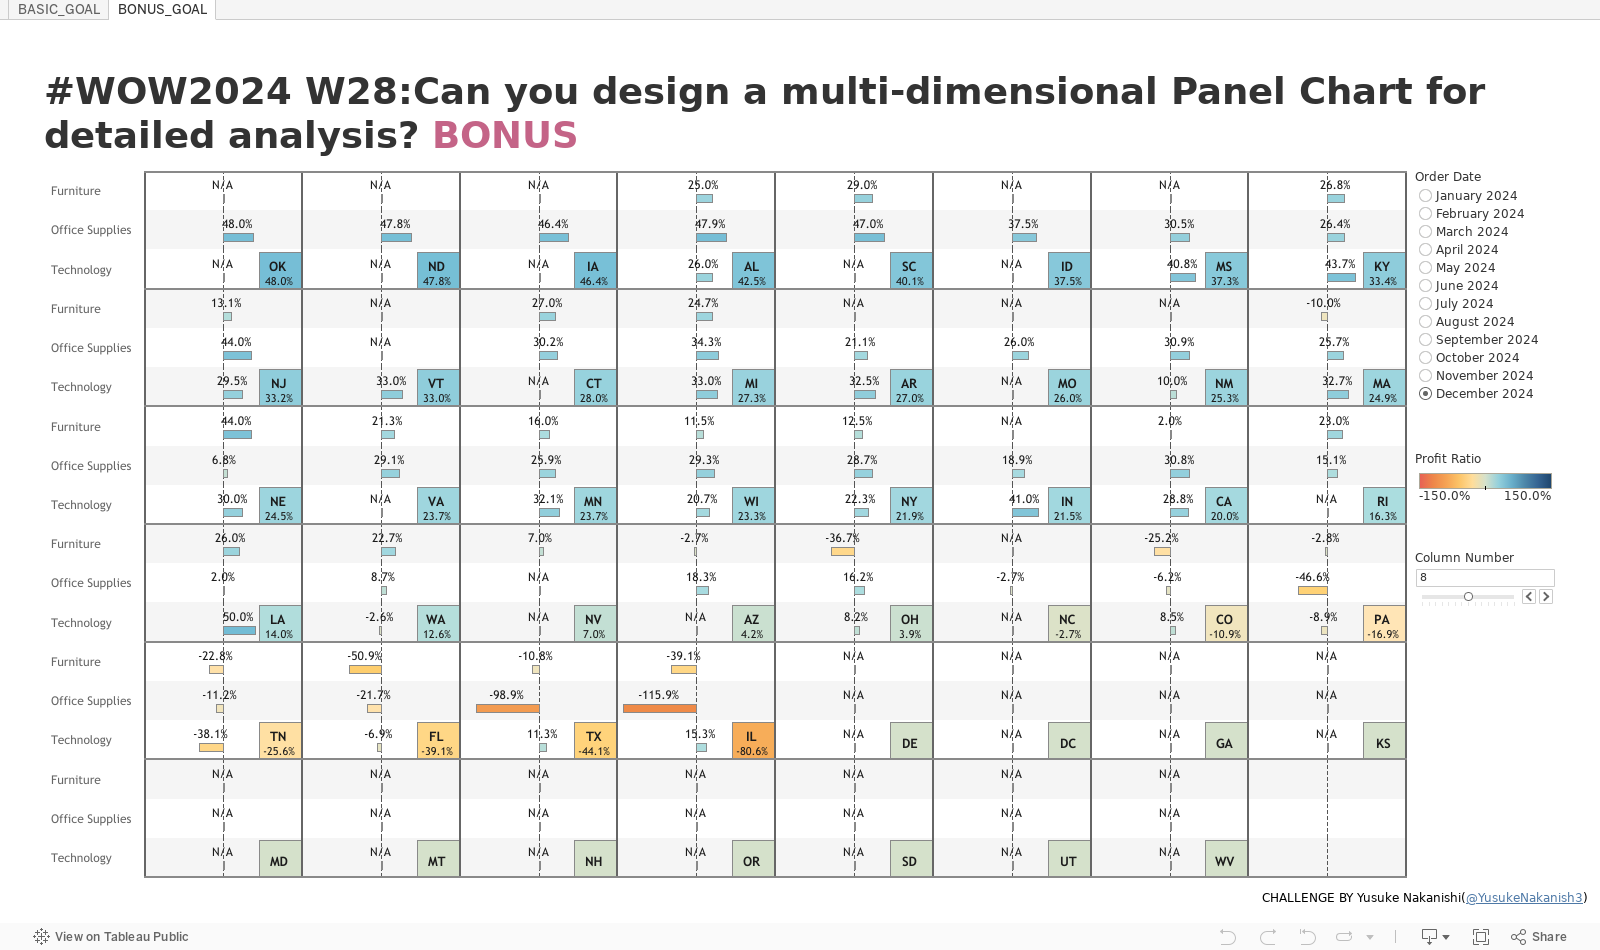
Do you like panel chart? I love it.
It is often requested in practical work because it is suitable for getting an overview.
This time, I am taking up some of the more challenging requests from past practical work.
I believe this will help you level up your panel chart skills, so please enjoy the challenge!
Requirements
Basic
- Dashboard size: 1600*900
 - Number of sheets: 1
 - Create a panel chart by state and show bar charts with profit ratios by categories.
 - Let users filter data by month for the year 2024.
 - Display the state’s abbreviations at the bottom right of each panel.
 - Ensure that panels are displayed even if there is no data for that state in the filtered month.
 - Display “N/A” for states/categories without data.
 - Color-code the profit ratio between -150% to 150%.
 - Make the axis ranges of the charts are symmetrical.
 
Bonus
- Color each square at the bottom right with the state’s total profit ratio.
 - Make the number of panel chart columns flexible.
 - Sort panels in descending order based on the total profit ratio for the selected month.
 - Display labels above the bar charts.
 
- Make the number of panel chart columns flexible.
 
Reference Articles
EN(Alexander Mou)
https://vizdiff.blogspot.com/2022/02/sizing-trellis-chart.html
JP(Yoshitaka Arakawa)
https://www.yarakawa.com/single-post/pane_chart_with_fixed_length
Dataset
This week uses superstore and State abbreviations . You can get a copy of them here.
Attribute
When you publish your solution on Tableau Public make sure to take the time and include a link to the original inspiration. Also include the hashtag #WOW2024 in your description to make it searchable!
															Share
After you finish your workout, share on Twitter and/or LinkedIn using the hashtag #WOW2024 #Tableau and tag @WorkoutWednsday


