Introduction
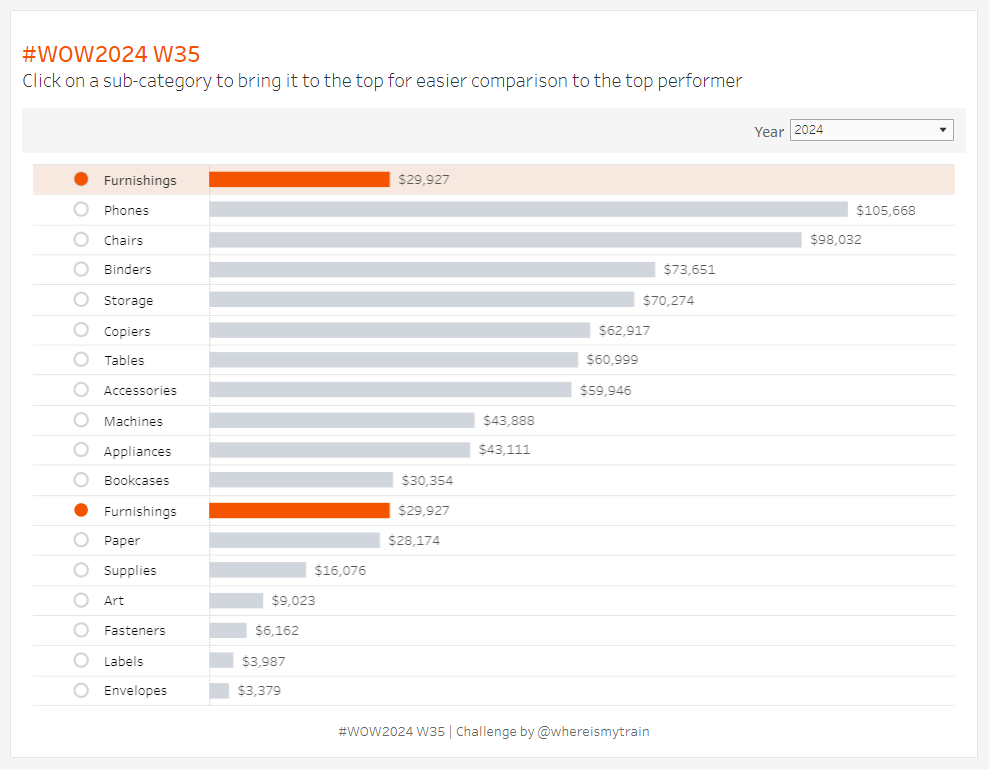
A huge thank you to Valerija Kirjackaja for sharing this fantastic challenge with us. It’s a little trickier than last week, this one is a classic #WOW – simple on the surface with lots of tricks behind the scenes. Reordering a chart using set or parameter actions is a pretty common use case – it allows us to compare the selected item (or person, or store) to the top performer more easily, especially when the list is too long to fit into a single view. This week, our guest coach Val is challenging you to bring the selected item to the top while also keeping it in its original place.
Requirements
Dashboard Size 900 x 700
One worksheet
Create a bar chart showing sales by sub-category for the selected year, allow the user click on any sub-category to bring it to the top of the list, while also keeping it in its original place.
Use colour to highlight the selected item.
Ensure alignment of the chart remains consistent when the year filter is updated
Dataset
This challenge uses Sample Superstore data (2024 version) with no filters applied. You can find the data source on Data.World
Attribute
When you publish your solution on Tableau Public make sure to take the time and include a link to the original inspiration. Also include the hashtag #WOW2024 in your description to make it searchable!

Share
After you finish your workout, share your solution:
- On Twitter using the hashtag #WOW2024 #Tableau and tag @WorkoutWednsday, @whereismytrain and @_hughej
- On LinkedIn using the tag Workout Wednesday, Tableau, Valerija Kirjackaja and Erica Hughes
