Deciding how to best use the limited space on a dashboard is always a challenge. I’ve often struggled with practical issues, especially regarding the placement of filters.
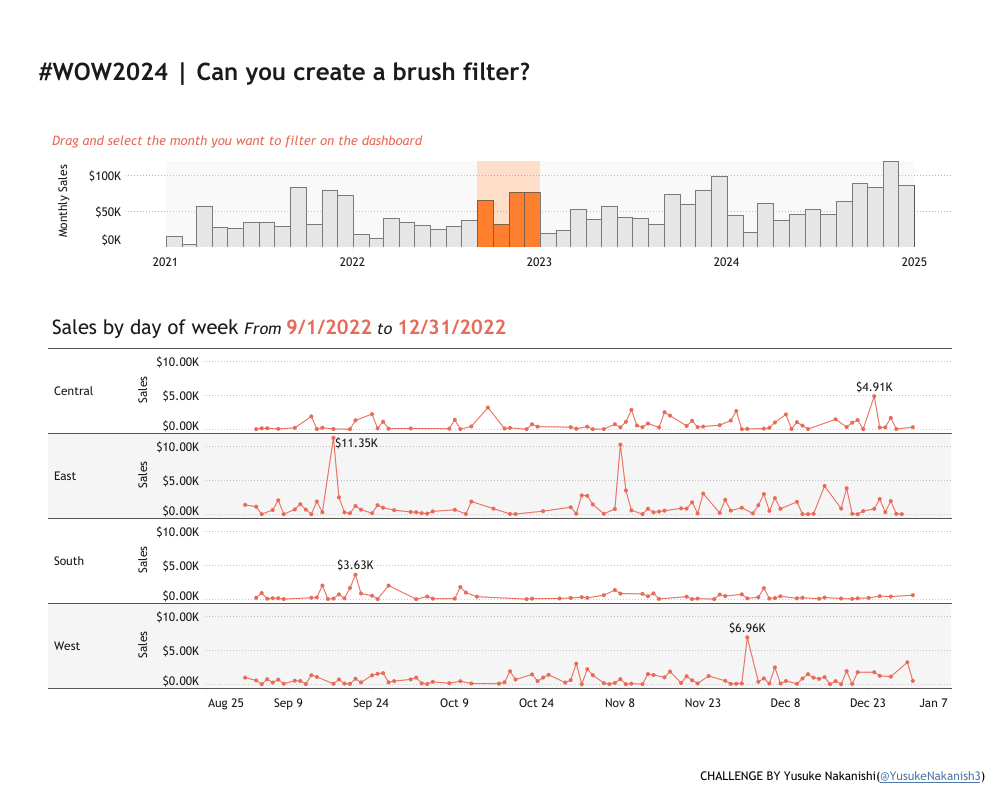
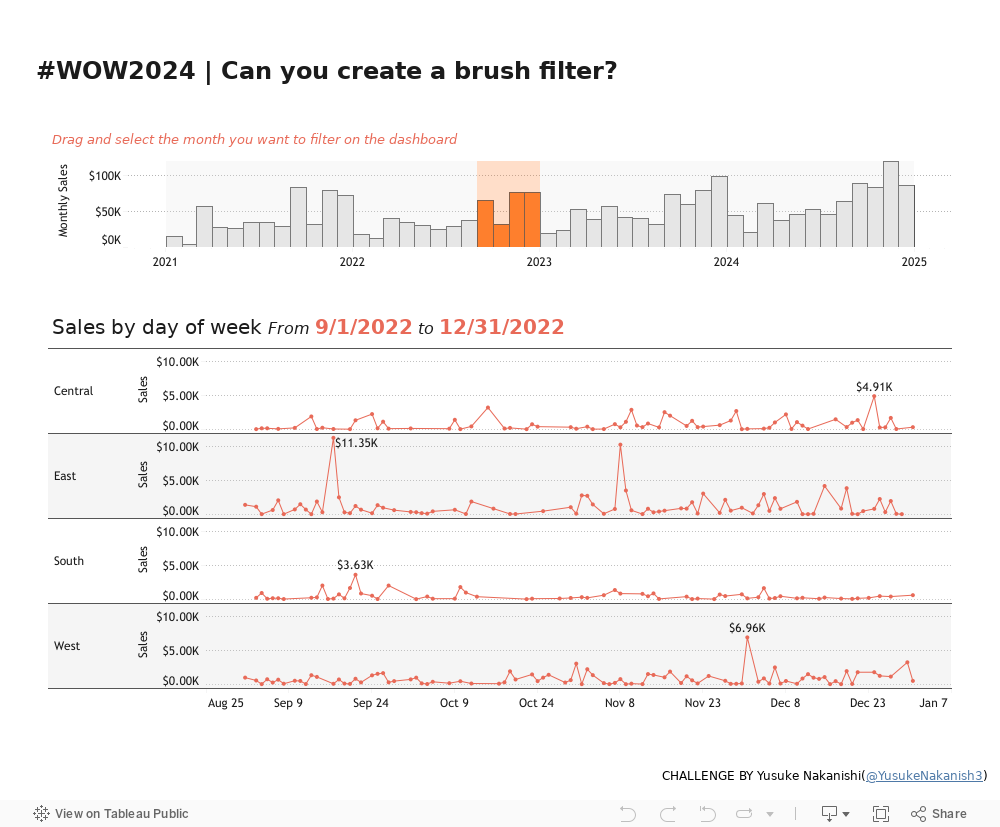
This time, let’s create a brush filter as one way to use the chart itself as a filter. Enjoy the challenge and have fun trying it out!”
The line chart is filtered based on the year and month selected in the bar chart.
Make it easier to select months with lower sales.
Display the currently shown period in the title of the line chart.
Match formatting and tooltips
Dataset
This week uses sample superstore dataset .You can get a copy of them here.
Attribute
When you publish your solution on Tableau Public make sure to take the time and include a link to the original inspiration. Also include the hashtag #WOW2024 in your description to make it searchable!