Introduction
This month we hold Global Community Weeks! We’ll feature guest coaches from around the world in the coming weeks. I’m excited and honored to introduce Tomoki Goda (@padawan_viz) from Japan!
Tomoki is relatively new to Tableau but is strongly passionate about Tableau community activities. He is one of the co-hosts of a popular Japan TUG event series called Viz Tsukurima Show (similar to a live WOW session). This challenge comes from a recent event and was originally designed to be solved in 10 minutes, but he has upgraded it for WOW participants. I hope you’ll have fun with the challenge!
Tomoki’s Challenge Introduction:
[JP]
私は2023年からWorkout WednesdayをはじめとしたTableauコミュニティに参加し、非常に多くのことを学ばせていただきました。特に日本のTableauユーザグループ(JTUG)ではハイレベルなメンバーに刺激を受ける毎日です。
今回はそのJTUGメンバーからお声がけいただき挑戦してみます。荒川さん、ありがとう!問題を解くばかりだったWorkout Wednesdayにゲストコーチとして参加することができ大変光栄です。
さて、今回のチャレンジはダッシュボードのテーマ変更です。
あなたはWebブラウザやアプリのダークテーマを使っていますか?バージョン2023.2ではTableau Mobileのダークモード対応がリリースされましたが、ダッシュボードやビューはもちろんダークモードにはなりません。
機能が実装されていないなら作ってしまおう!ダッシュボード上でテーマを変更しよう!
そんなアイデアから今回のチャレンジは生まれました。ぜひ楽しんでいってください!
[EN]
I started my journey in the Tableau community with Workout Wednesday in 2023. That has been filled with many learning opportunities that sharpened my skills and deepened my passion for data. I appreciate the community for always inspiring me.
I’m thrilled to contribute as a guest coach. Thanks Yoshi for the invitation!
This week, I’ve crafted a unique challenge around theme customization inspired by the flexibility of dark mode in apps and web browsers.
While Tableau Mobile introduced dark mode in version 2023.2, dashboards and views still lack this functionality – so why not create it ourselves?
The challenge encourages you to implement a theme switcher on their dashboards, pushing Tableau’s design capabilities to the next level. I hope you enjoy this challenge!
Requirements
[JP]
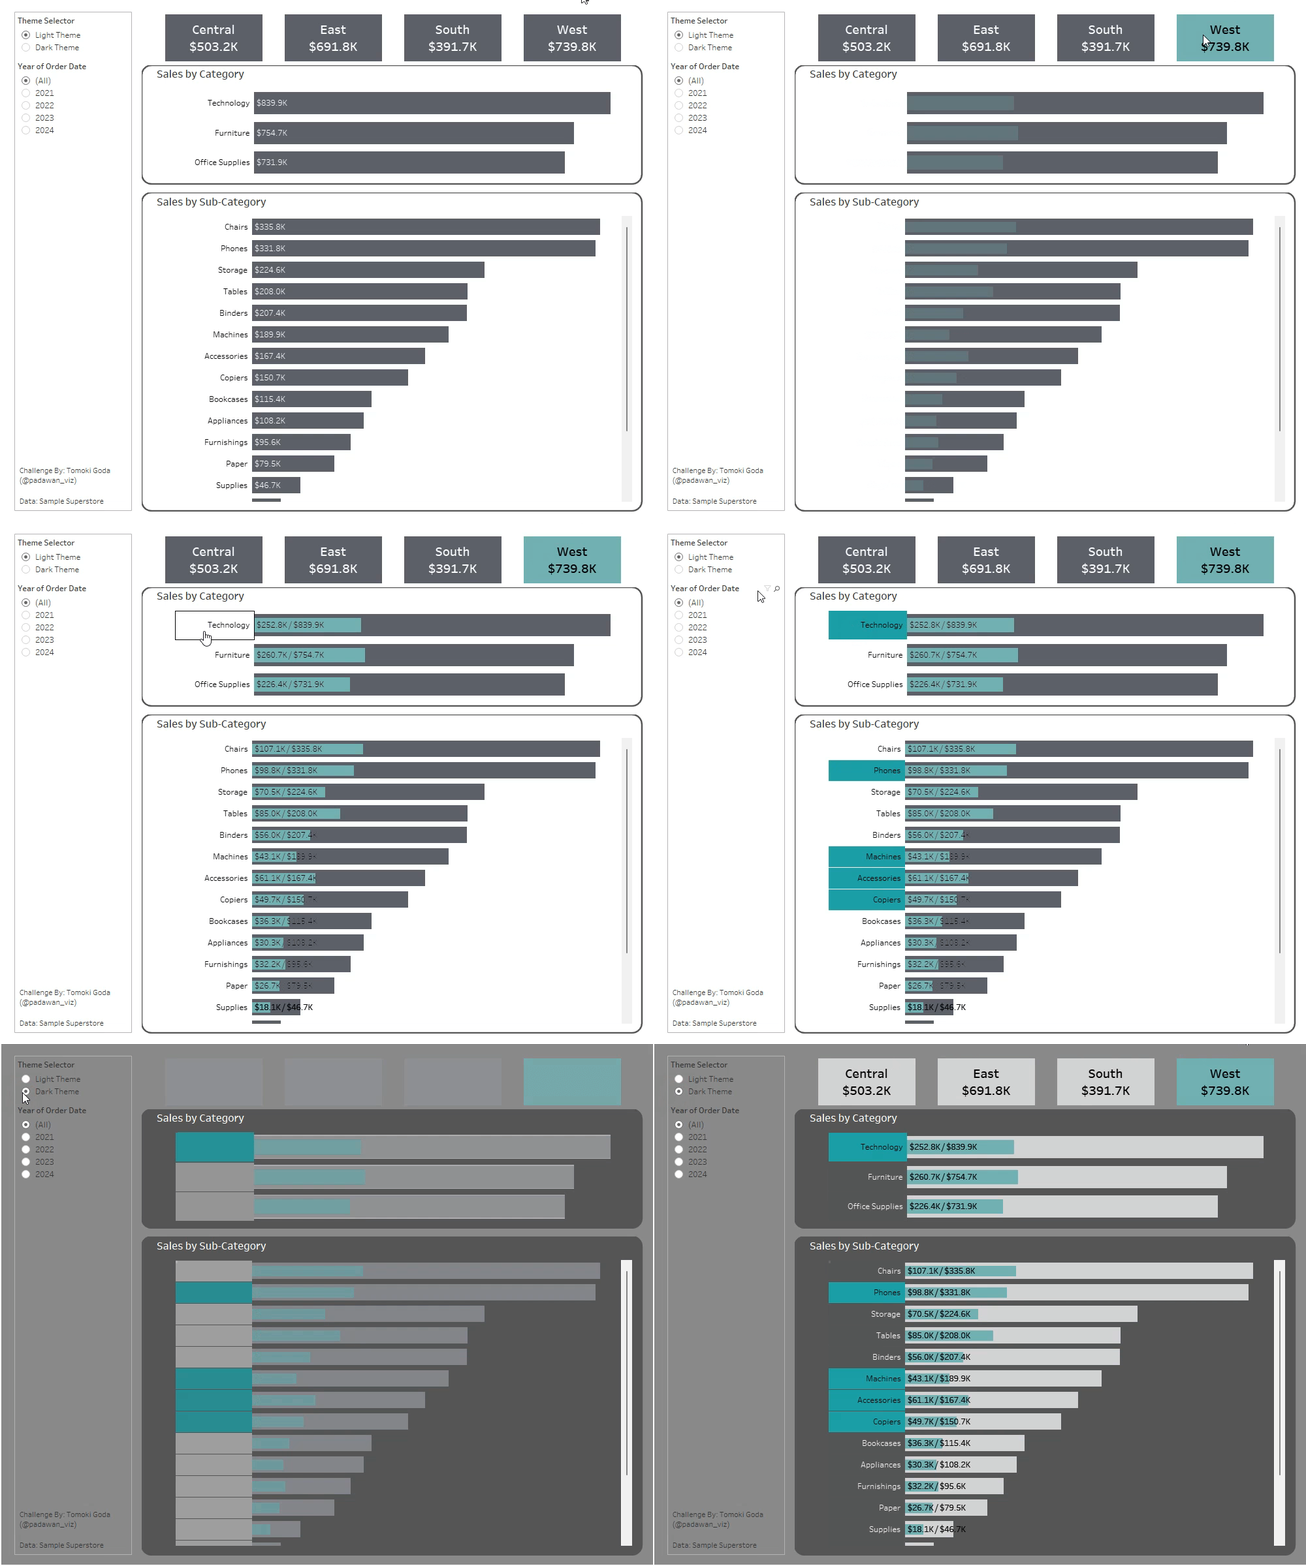
- ダッシュボードサイズ:1000 x 800ピクセル
- シート数:必要な数だけ
- オーダー年でフィルターできるようにする。
- 地域ごとの売上を表示する。
- クリックされた地域の色を変え、強調されるようにする。
- カテゴリごと、サブカテゴリごとの売上棒グラフをそれぞれ作成する。
- 選択された地域の売上および全地域合計の売上を表示し、比較できるようにする。
- カテゴリをクリックすると、そのカテゴリと含まれるサブカテゴリのヘッダー色が変わり、強調表示されるようにする。
- 棒グラフが角丸で囲われるようにする。
- ライトテーマとダークテーマを切り替えられるようにする。その際、以下を変化させること。
- ダッシュボードの背景色
- 選択されていない地域
- 各カテゴリ/サブカテゴリの全地域合計の売上棒グラフ
- 棒グラフの背景色とタイトル色
[EN]
- Dashboard Size: 1000 x 800 px
- Sheets: As many as you want
- Include a filter for Order Year
- Display sales by region
- Change the color of the selected region to highlight it
- Create two bar charts for sales by category/sub-category
- Show both the sales of the selected region and the total sales across all regions for comparison
- When a category is clicked, change the header color of that category and its sub-categories
- Style the charts with rounded corners
- Allow users to switch between light and dark themes. Make sure the below colors differ:
- The dashboard background
- Unselected regions
- Total sales of each category/sub-category
- The bar charts background and titles
Dataset
- This challenge uses Superstore out of the box available in Tableau Desktop. You can also find it on data.world here.
Attribute
When you publish your solution on Tableau Public make sure to take the time and include a link to the original inspiration. Also include the hashtag #WOW2024 in your description to make it searchable!

Share
After you finish your workout, share on Twitter and/or LinkedIn using the hashtag #WOW2024 #Tableau and tag @padawan_viz and @WorkoutWednsday
