Introduction
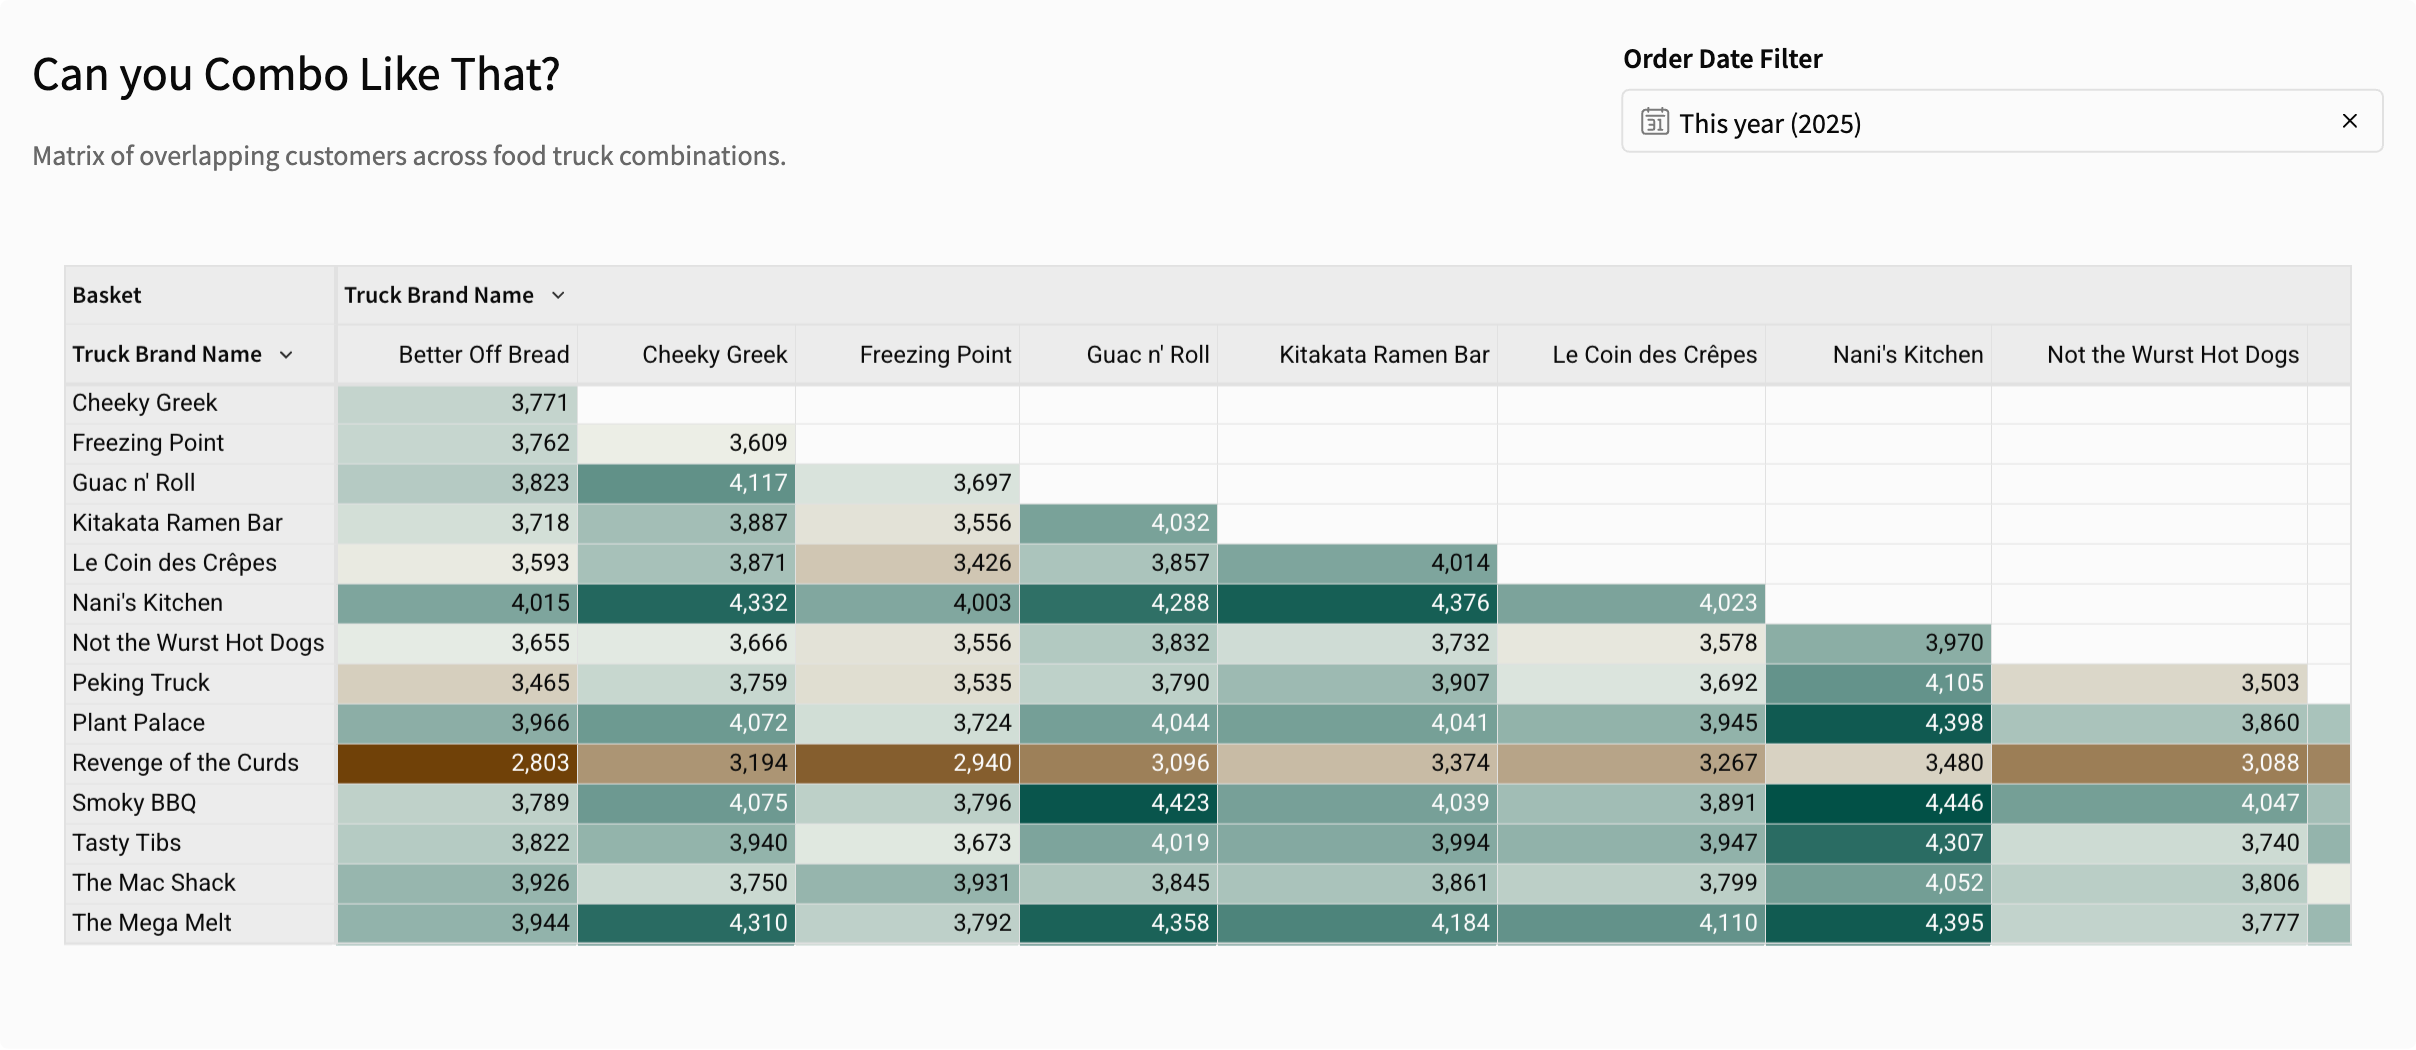
This week, we’re building a market basket or matrix analysis to help us understand the frequency of combinations. For this week’s challenge, we’re looking at which Food Trucks have the most customers in common.
Have Fun!
Katrina
Need access to Sigma?
Note: You will only have view access to WOW Workbooks, Folders, and Workspaces, not edit access. Please create your WOW Workbooks under “My Documents.” We suggest creating a folder to organize all your workbooks.
Requirements
- Create a table showing truck brand names on columns and rows
- Show the count of customers who have attended each combination of trucks
- For example, the intersection of Cheeky Greek and Peking Truck would display the number of unique customer IDs who have eaten at both trucks.
- Hint: Think about how to manipulate the data structure so each customer’s records can show up more than once (once per row and once per column)
- Add a Divering Background color
- Can choose any colors
- Add an Order Date Filter for the current year
- Match other formatting
Dataset
Sigma Sample Database > Retail > Tasty Bytes Food Trucks > Fact Orders
Share
After you finish your workout, share on LinkedIn, Sigma’s Community page, (or Twitter) using the hashtags #WOW2024 and #SigmaComputing, and tag Ashley Bennett, Eric Heidbreder, Katrina Menne, Carter Voekel, and Michal Shaffer!
Create an interactive, sharable version of your solution here.
Also, make sure to fill out the Submission Tracker so that we can count you as a participant this week to track our participation throughout the year.
Solution
Coming Soon…