Introduction
Welcome to Week 24 of 2025!
This week, we’re going to illustrate the difference between two of Sigma’s newer features: Modals and Popovers. These layout elements are very similar, but have slightly different functionality and visual differences.
Good luck!
-Ashley
Need access to Sigma?
Note: You will only have view access to WOW Workbooks, Folders, and Workspaces, not edit access. Please create your WOW Workbooks under “My Documents.” We suggest creating a folder to organize all your workbooks.
Requirements
- Hidden Data Sheet:
- Use the all of the tables in Sigma Sample Database / Fun / Call_Center
- Calls_Log. This will be the main driving table
- Agents
- Customers
- Escalations
- Use lookups to find dimensional information in the Calls_Log:
- Agent Name
- Customer Name
- Escalation Level, Status, and Reason
- Use the all of the tables in Sigma Sample Database / Fun / Call_Center
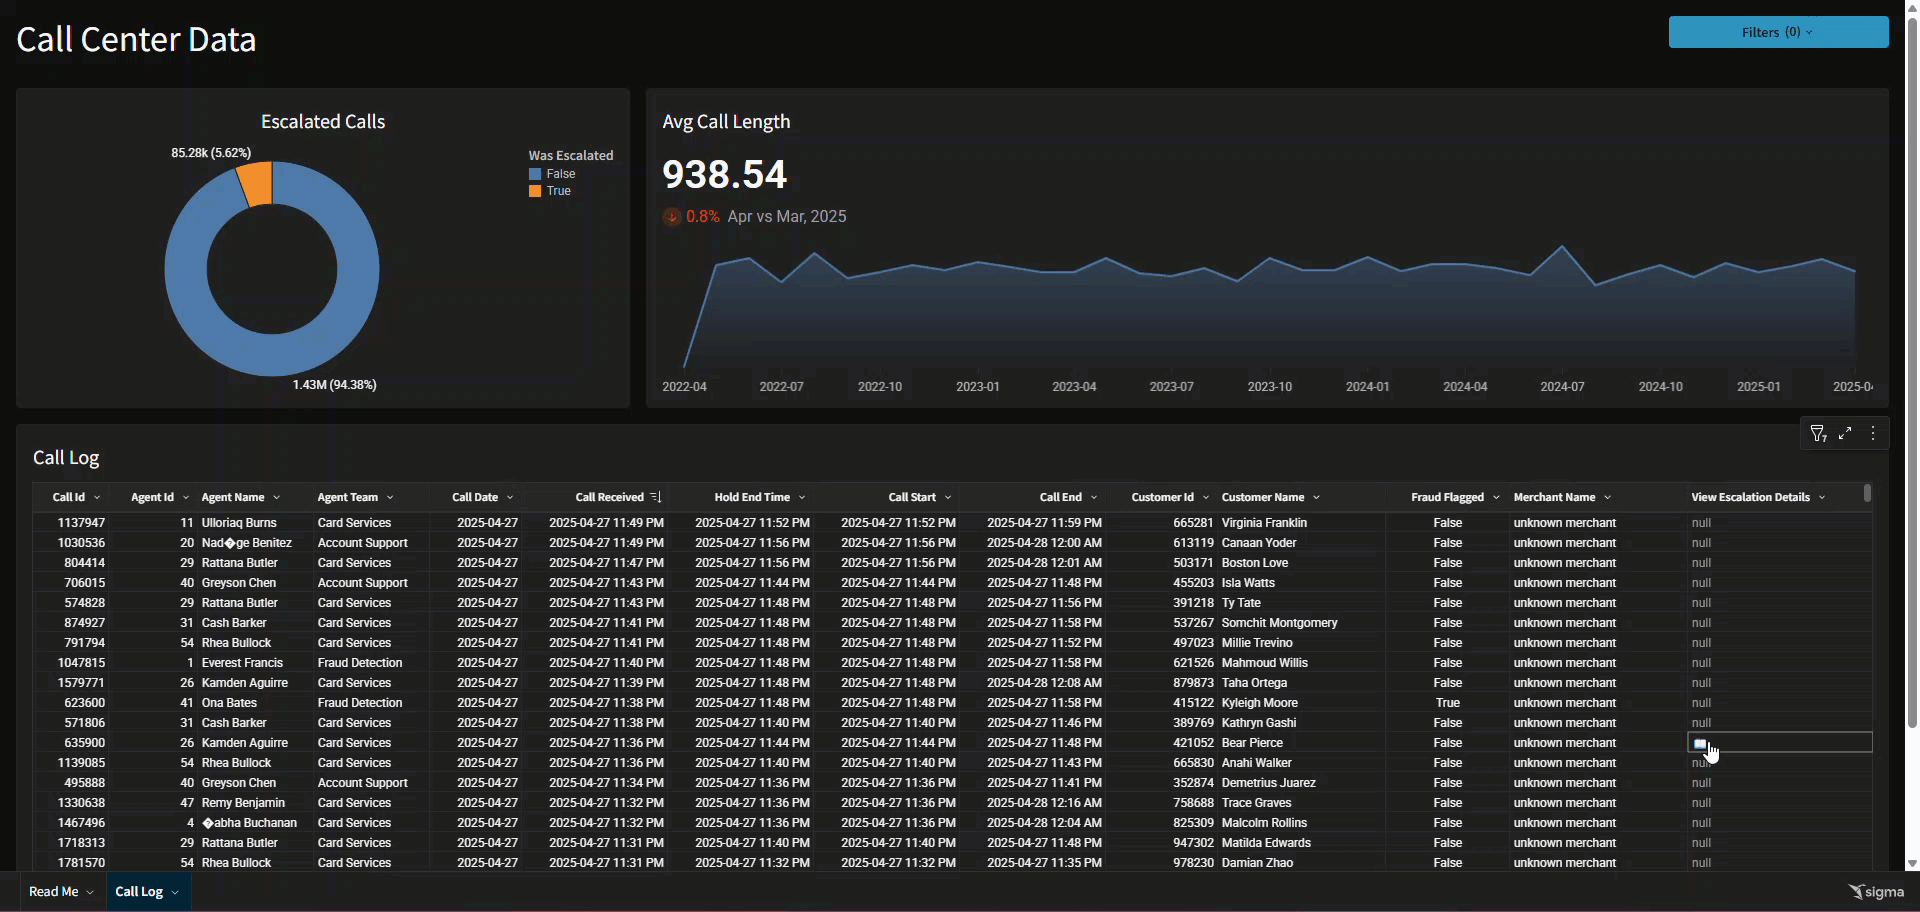
- Your final workbook should display only these elements:
- A donut chart showing number of calls that were and were not escalated
- Color: Was Escalated
- Value: Count of Call ID
- A KPI chart showing Avg Call Length
- Value: Avg Call Length
- Call Length is the seconds between Call Received and Call End
- Timeline: Month of Call Date
- Comparison: Previous Month
- Value: Avg Call Length
- A table of all Call Log information:
- Hide Escalation information. Instead, provide a column that when clicked will open a modal displaying the escalation information. Bonus points for only allowing the modal to open when the record selected has been escalated.
- Add filters to a popover:
- Agent Name & Team
- Customer Name
- Call Date
- Escalation: Was Escalated, Level, Status, Reason
- Merchant Name
- Fraud Flagged
- Show the filter count on the popover button
- Add a button to clear filters in this popover
- A donut chart showing number of calls that were and were not escalated
- Finishing Touches
- Give the dashboard a descriptive title
- Arrange your elements into a cohesive dashboard
- Update your workbook’s settings to give it a more personalized flair
- Tips
- There are multiple ways to display the information in the modal
- Use a container to easily reset your filters in the popover
Dataset
- Sigma Sample Database / Fun / Call_Center
- Calls_Log. This will be the main driving table
- Agents
- Customers
- Escalations
Share
After you finish your workout, share on LinkedIn, Sigma’s Community page, (or Twitter) using the hashtags #WOW2024 and #SigmaComputing, and tag Ashley Bennett, Eric Heidbreder, Katrina Menne, Carter Voekel, and Michal Shaffer!
Create an interactive, sharable version of your solution here.
Also, make sure to fill out the Submission Tracker so that we can count you as a participant this week to track our participation throughout the year.