Introduction
Welcome to Week 25 of 2025!
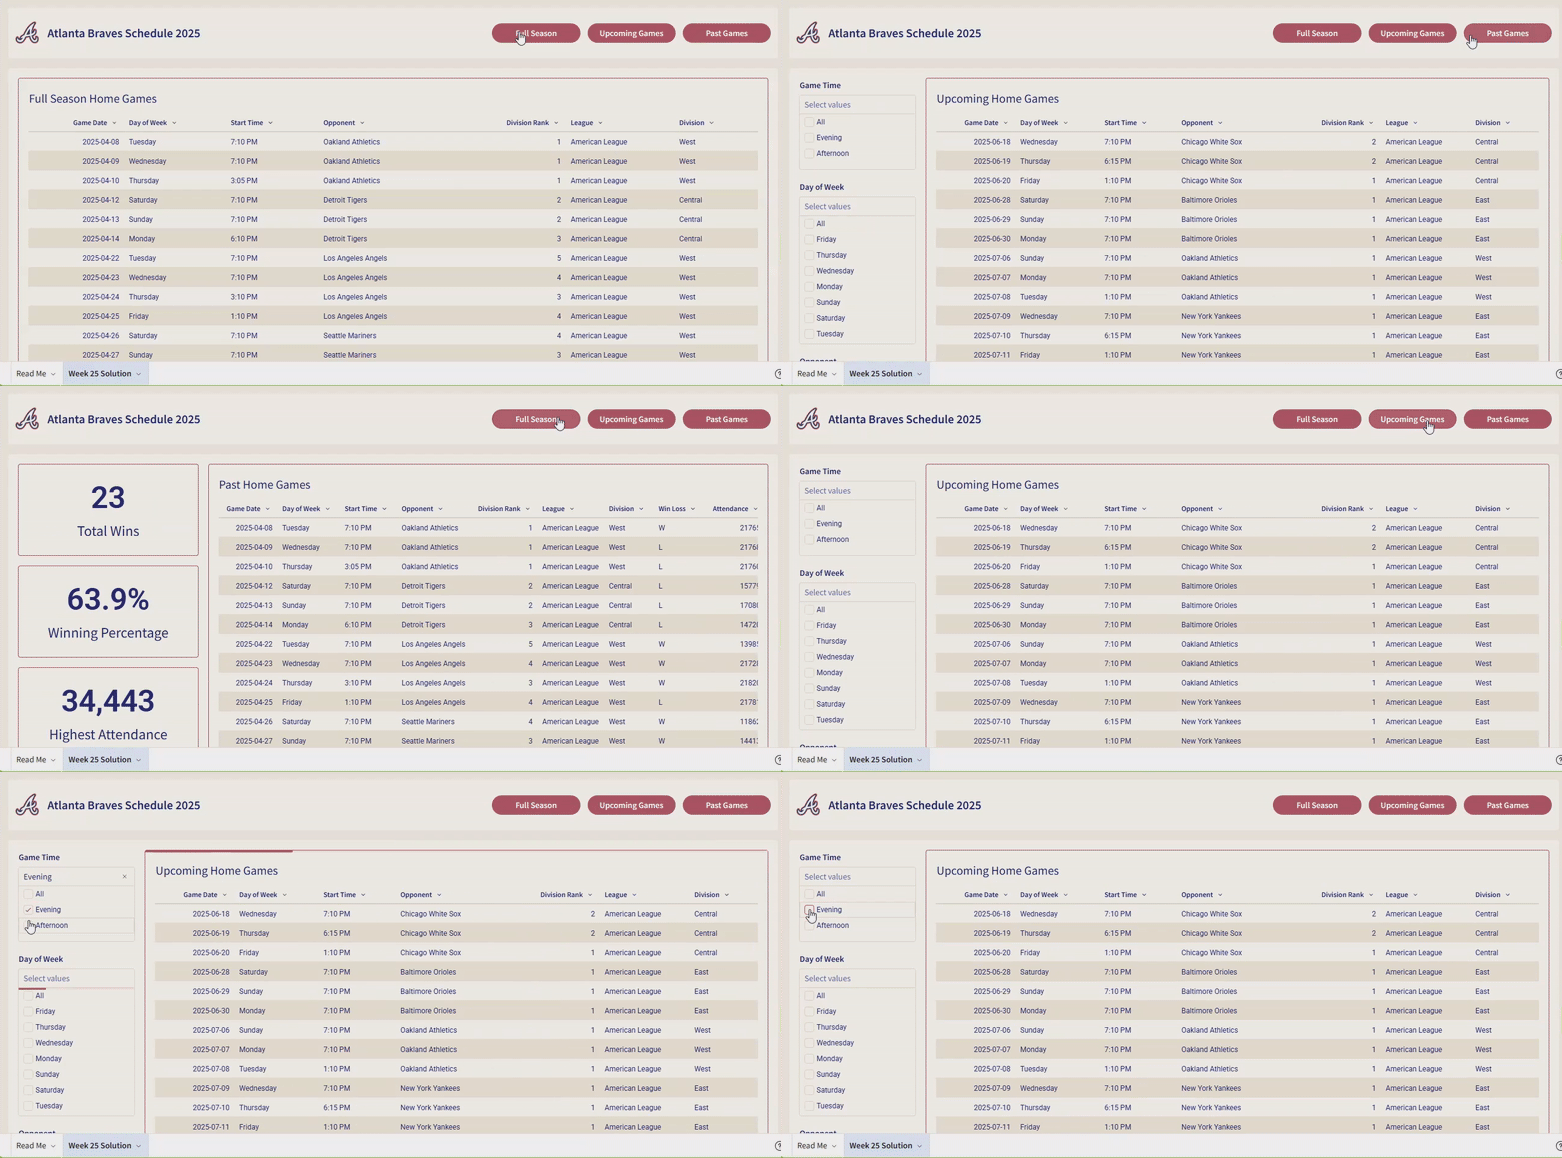
This week, we’re going to work with tabbed containers and show how to easily navigate the end user to new content without the need for additional pages in your workbook. This helps save precious real estate on your dashboard and creates a seamless user experience.
Good luck!
-Jess
Need access to Sigma?
Note: You will only have view access to WOW Workbooks, Folders, and Workspaces, not edit access. Please create your WOW Workbooks under “My Documents.” We suggest creating a folder to organize all your workbooks.

Requirements
- Hidden Data Sheet:
- Sigma Sample Database / Retail / MLB Stadium Sales / D_Home_Games (main table to be used)
- The data in this table is from 2021, use a formula to change all the years in the date column to be this year (2025)
- Also create calculations to flag:
- What day of the week each game is on
- If the games are in the afternoon or evening
- Use lookups to pull in dimensional information from D_MLB_Teams:
- League
- Division
- Sigma Sample Database / Retail / MLB Stadium Sales / D_Home_Games (main table to be used)
- Your final workbook should have a single visible page that contains:
- A title and logo from your local MLB team
- A tabbed container with 3 tabs (tab bar should hidden):
- Tab 1 should contain:
- Table element with the full season schedule showing: Game Date as a date (no timestamp), Day of Week (calculated field), Start Time, Opponent, Division Rank, League, Division
- Tab 2 should contain:
- Table element with the with only the upcoming games showing: Game Date as a date (no timestamp), Day of Week (calculated field), Start Time, Opponent, Division Rank, League, Division
- 3 filters targeted at the table on this tab
- One should allow the user to filter evening or afternoon games
- Another should allow the user to select games on specific days of the week
- The last should allow the user to filter to a specific opponent
- Tab 3 should contain:
- Table element with the with only the completed games showing: Game Date as a date (no timestamp), Day of Week (calculated field), Start Time, Opponent, Division Rank, League, Division, Win Loss, and attendance
- 3 KPI tiles:
- One should show the total number of wins so far this season
- Another should show the winning percentage
- The final should show the highest attendance of a game so far this season
- Tab 1 should contain:
- 3 buttons with actions associated to navigate the user to each tab
- Buttons should be named to correspond to the tag they are set to navigate to
- Finishing Touches
- Update the colors to correspond to your local team
- Use table formatting options to give your tables a nice presentation ready look
Dataset
Sigma Sample Database > Retail > MLB Stadium Sales > D_Home_Games & D_MLB_Teams
Share
After you finish your workout, share on LinkedIn, Sigma’s Community page, (or Twitter) using the hashtags #WOW2024 and #SigmaComputing, and tag Ashley Bennett, Eric Heidbreder, Jess Batten, Carter Voekel, and Michal Shaffer!
Create an interactive, sharable version of your solution here.
Also, make sure to fill out the Submission Tracker so that we can count you as a participant this week to track our participation throughout the year.
Solution
Coming Soon…