Introduction
As we all prepare ourselves (and our dogs) for this weekend in the US, let’s be careful out there. I’ve been on a bit of a kick of perusing government websites for data lately, and I’ve been surprised at how easy it is to pull data on a number of topics. This week, I’m focused on fireworks-related injuries, and wanted to show off some of the static-visualization features Sigma has to offer.
Need access to Sigma?
Note: You will only have view access to WOW Workbooks, Folders, and Workspaces, not edit access. Please create your WOW Workbooks under “My Documents.” We suggest creating a folder to organize all your workbooks.
Requirements
- Get your data
- Workspaces / Workout Wednesday / 2025 / 2025W27 – Can you stay safe this 4th of July? / NEISS Firework Incidents / NEISS Firework Incidents
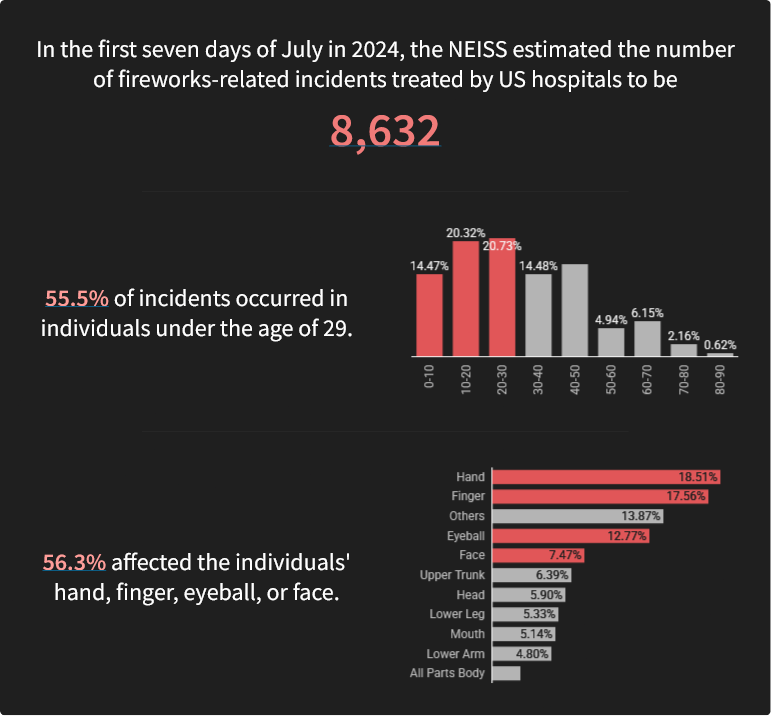
- Build your bar charts
- Weight by Age Bin (Displayed as a Percent of Grand Total)
- Create a new calculation to make any Age < 30 = True, otherwise False
- Set the new calculation as the ‘Color’ option in the visualization
- Customize colors as desired
- Weight by Body Part (Displayed as a Percent of Grand Total)
- Limit display values to the Top 10 by right clicking on the ‘Body Part’ in the Y-Axis > Transform > Limit Display Values
- Create a new calculation to make any Body Part in (“Hand”, “Finger”, “Eyeball”, “Face”) = True, otherwise False
- Set the new calculation as the ‘Color’ option in the visualization
- Customize colors as desired
- Weight by Age Bin (Displayed as a Percent of Grand Total)
- Build your text boxes
- There are a few ways you could do this, I chose to use calculated values for all the values highlighted in red by calculating them in the text boxes directly.
- Top box
- Created a KPI in the ‘Source’ tab called ‘Number of Incidents’ where the value was the Sum of Weight
- Used the following formula in the textbox: [Number of Incidents/Sum of Weight]
- Middle box
- SumIf([Weight by Age Bins and Highlight Age/Weight (1)], [Weight by Age Bins and Highlight Age/Age] < 30) / Sum([Weight by Age Bins and Highlight Age/Weight (1)])
- Bottom box
- SumIf([% of Incidents by Body Part/Weight (1)], In([% of Incidents by Body Part/Body Part], “Hand”, “Finger”, “Eyeball”, “Face”)) / Sum([% of Incidents by Body Part/Weight (1)])
- Customize colors and format to taste
- Recommend going to workbook settings and changing to dark mode
- Recommend putting all the elements into a container to get them to feel unified
- Recommend adding subtle dividers between each section to give it some breathing room
Dataset
Tables and Datasets /Workspaces / Workout Wednesday / 2025 / 2025W27 – Can you stay safe this 4th of July? / NEISS Firework Incidents / NEISS Firework Incidents
Share
After you finish your workout, share on LinkedIn, Sigma’s Community page, (or Twitter) using the hashtags #WOW2025 and #SigmaComputing, and tag Ashley Bennett, Eric Heidbreder, Jessica Batten, and Carter Voekel!
Create an interactive, sharable version of your solution here.
Also, make sure to fill out the Submission Tracker so that we can count you as a participant this week to track our participation throughout the year.
Solution
Coming Soon!