Introduction
Welcome to Week 35 of 2025!
When building reports in Power BI, one of the most common requests I hear from users is:
“Can I explore different KPIs side by side without creating dozens of visuals?”
The good news: yes, you can! And it’s cleaner than ever with field parameters grouped by category.
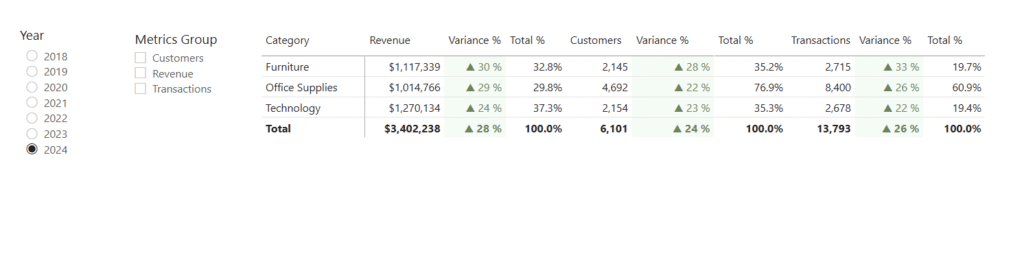
In this week’s challenge, we’ll build a report where users can dynamically switch between Revenue, Customers, and Transactions — all within the same matrix visual. Instead of duplicating visuals or adding endless slicers, we’ll let users pick a group of metrics and instantly see the relevant KPIs (value, variance, and % of total).
Requirements
To build this report, you’ll need the following pieces in place:
Dataset
A table with base measures for:
- Revenue
- Customers
Transactions
Each with supporting calculations for variance % and % of total.
Base Visual
A matrix visual with:
- Category on the rows
- Metrics dynamically controlled by a field parameter
Grouped Field Parameters
A custom field parameter table structured into groups:
- Revenue → Revenue, Variance %, Total %
- Customers → Customers, Variance %, Total %
- Transactions → Transactions, Variance %, Total %
Slicer for Metrics Group
A slicer that lets users choose the group they want to see.
For example, selecting “Revenue” displays only the Revenue set of columns in the matrix.
Share Your Work
Inspired by the Workout Wednesday approach, this dashboard supports easy storytelling and collaboration.
Share your version with hashtags like #WOW2025 and #PowerBI.
Dataset
Find this week’s dataset in Excel at: Workspaces / Workout Wednesday / 2025 / 2025W21 – Sales
Share
After you finish your workout, share on social media using the hashtags #WOW2025 and #PowerBI. Tag me (Andrei) on LinkedIn, along with Meagan, Kerry, and Shannon.
On Bluesky, tag @mmarie.bsky.social, @shan-gsd.bsky.social, and @merrykerry.bsky.social.