Introduction
Welcome to Week 36 of 2025!
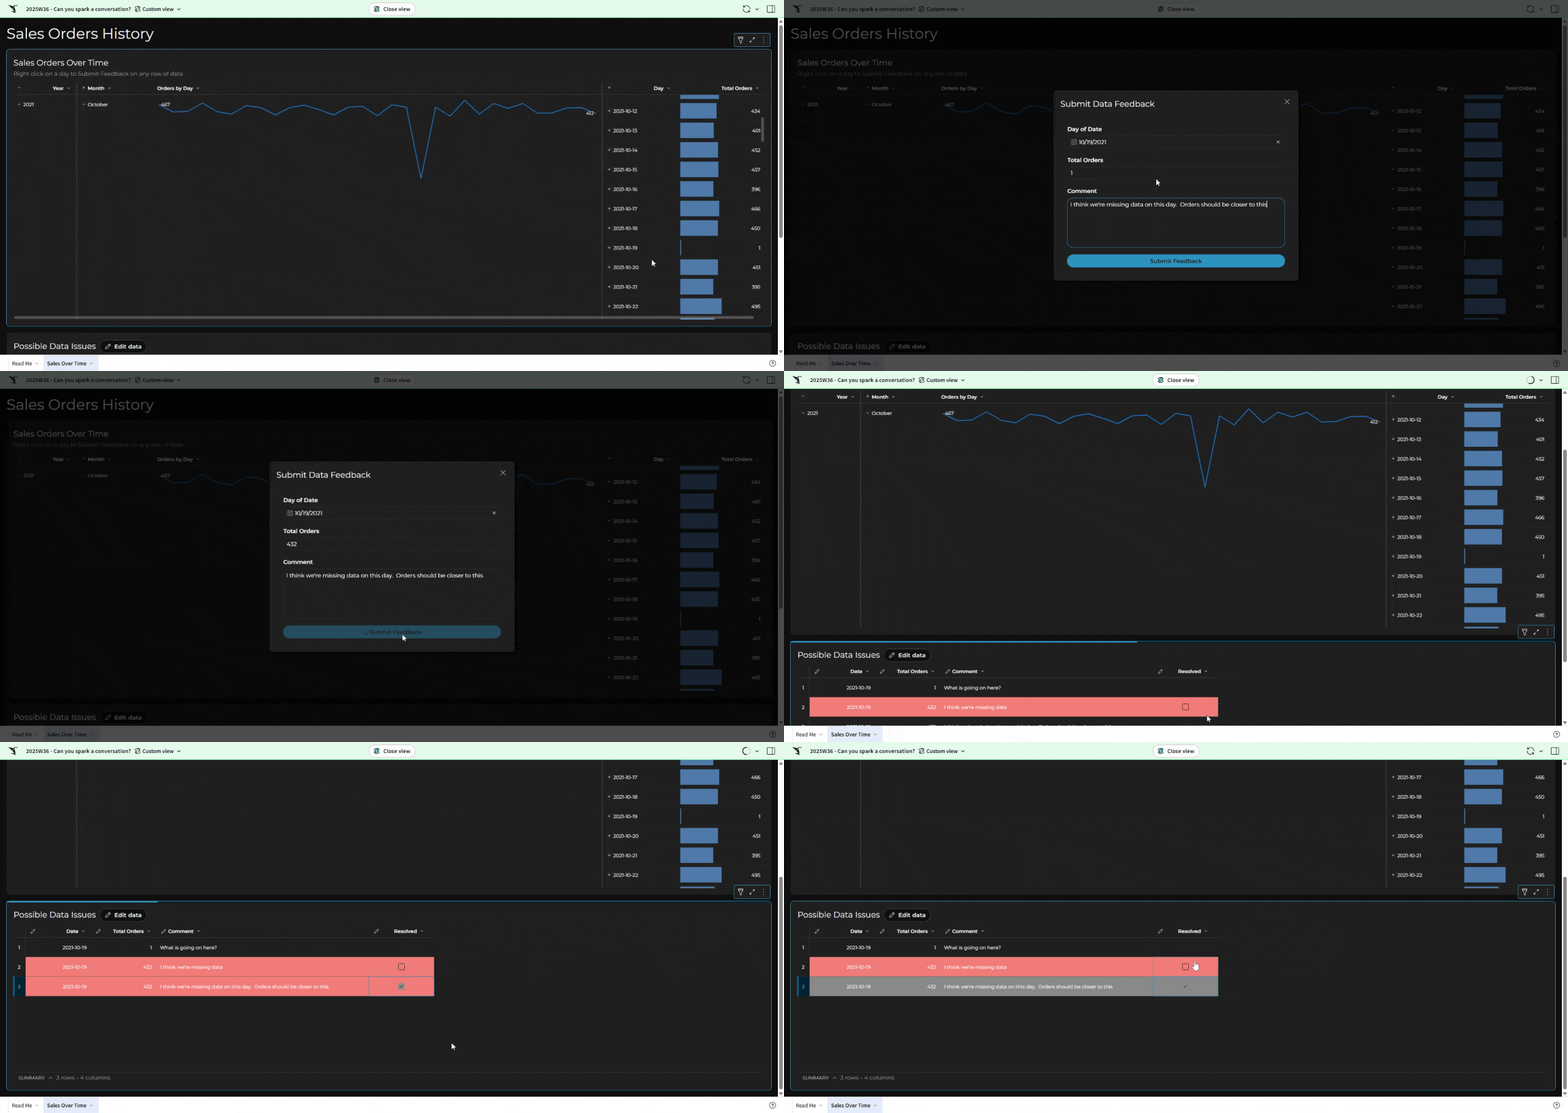
This week, we’re going to learn how to use a new feature of Sigma: Sparklines! We’re going to use sparklines to enhance sales data over time and illuminate some potential data issues.
Then, we’ll create a mini Data App that allows end users to flag rows as with comments, and finally, allow a user to mark those issues as resolved.
Good luck!
-Ashley
Need access to Sigma?
Note: You will only have view access to WOW Workbooks, Folders, and Workspaces, not edit access. Please create your WOW Workbooks under “My Documents.” We suggest creating a folder to organize all your workbooks.
Requirements
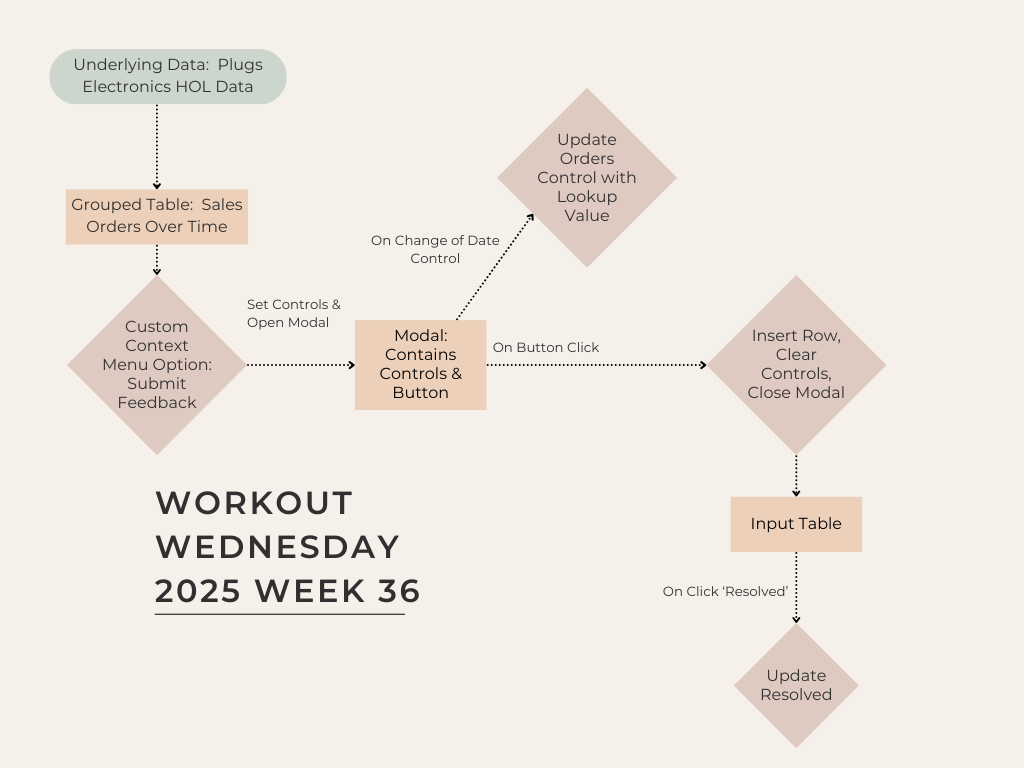
When I build Data Apps, I find planning is most important part of the process. As you build your workflow, you may find yourself returning to created objects, more often than usual, to create actions involving newly created objects. To help illustrate what we’re doing, I have included a flowchart at the bottom of this challenge.
- Hidden Data Sheet:
- RETAIL / PLUGS_ELECTRONICS / PLUGS_ELECTRONICS_HANDS_ON_LAB_DATA
- This will be the parent data source to our Grouped Table
- RETAIL / PLUGS_ELECTRONICS / PLUGS_ELECTRONICS_HANDS_ON_LAB_DATA
- Your final workbook should display only these elements:
- A Grouped Table called Sales Orders Over Time
- Create 3 groupings:
- Year
- Month
- Include an Orders by Day Sparkline
- Display the Month Name, but be sure it is sorted chronologically
- Day
- Include a calculated column finding the Total Orders (hint: use a CountDistinct)
- Formatting:
- Add a description that alerts users to the Custom Context Menu Option that allows them to Submit Feedback
- Do not show Collapsed Columns or the Summary Bar
- Use a Large Presentation table style
- Show the endpoint labels on your sparkline
- Add a Custom Context Menu Option “Submit Feedback on this Day”
- Add Data Bars Conditional Formatting to Total Orders
- Collapse this table at the Month level
- Actions:
- On Cell Context Menu: Submit Feedback on this Day
- Set Day Control (in Modal)
- Set Total Orders Control (in Modal)
- Open Modal
- On Cell Context Menu: Submit Feedback on this Day
- Create 3 groupings:
- An Empty Input Table called Possible Data Issues
- Include 4 visible columns:
- Day (Date Type)
- Total Orders (Number Type)
- Comment (Text Type)
- Resolved (Checkbox Type)
- Also include 3 hidden columns:
- Original Orders: Use a lookup function to find that day’s Total Orders in grouped Sales Orders Over Time table
- Order Count Difference: Find the difference between the input Total Orders and Original Orders
- Add a Row ID System Column
- Conditional Formatting:
- Highlight rows gray where Resolved = True
- Highlight rows red where there is a difference between the input Total Orders and the Original Orders
- Actions:
- On Select of the Resolved column, toggle to the opposite value
- Note that newly input rows may contain a null, so you will need to use a formula that changes False to True, True to False, and null to True
- Tip: This is a UI enhancement. A user could also Edit Data, click the checkbox, and click Save. Adding this simple action on a checkbox field saves the user some clicks.
- On Select of the Resolved column, toggle to the opposite value
- Include 4 visible columns:
- A Modal called Submit Data Feedback
- Include 3 controls:
- Day (Date Type)
- Action: On change, set the Total Orders control to the value in the Sales Orders Over Time grouped table
- We need this action in case the user changes the Date after opening the modal
- Total Orders (Number Input)
- Comment (Text Area)
- Day (Date Type)
- Include 1 button to Submit Feedback that performs these actions on click:
- Insert a row into our Possible Data Issues Input Table
- Use the controls to input the appropriate columns
- Leave Resolved as False
- Clear controls on this modal
- Close the modal
- Insert a row into our Possible Data Issues Input Table
- Include 3 controls:
- A Grouped Table called Sales Orders Over Time
- Finishing Touches
- Give the dashboard a descriptive title
- Arrange your elements into a cohesive dashboard
- Update your workbook’s settings to give it a more personalized flair
- Tips
- Prefix your controls with a meaningful label. As your Data Apps get more complex, developers will appreciate knowing which “Day” control is which when selecting a field in the formula bar. For today’s exercise, we might use “fdbk-” to denote our controls are on the Feedback modal
- Put all of the modal’s controls into a container, so you can easily clear them with one action

Dataset
RETAIL / PLUGS_ELECTRONICS / PLUGS_ELECTRONICS_HANDS_ON_LAB_DATA
Share
After you finish your workout, share on LinkedIn, Sigma’s Community page, (or Twitter) using the hashtags #WOW2024 and #SigmaComputing, and tag Ashley Bennett, Eric Heidbreder, Jessica Batten, and Carter Voekel!
Create an interactive, sharable version of your solution here.
Also, make sure to fill out the Submission Tracker so that we can count you as a participant this week to track our participation throughout the year.
