Set actions came out almost 7 years ago, and only had about 3 quarters in the spotlight until parameter actions came out. Both are very powerful, but I would venture that most people (myself included) tend to use parameter actions more. So here’s your chance to give Set actions a go.
Shortly after Set actions were released, Lindsey Poulter blew my mind with all of the examples she came up with, while I was still trying to wrap my brain around Sets themselves. This is my take on one of those examples, using set actions to make viz in tooltip with highlighting in context.
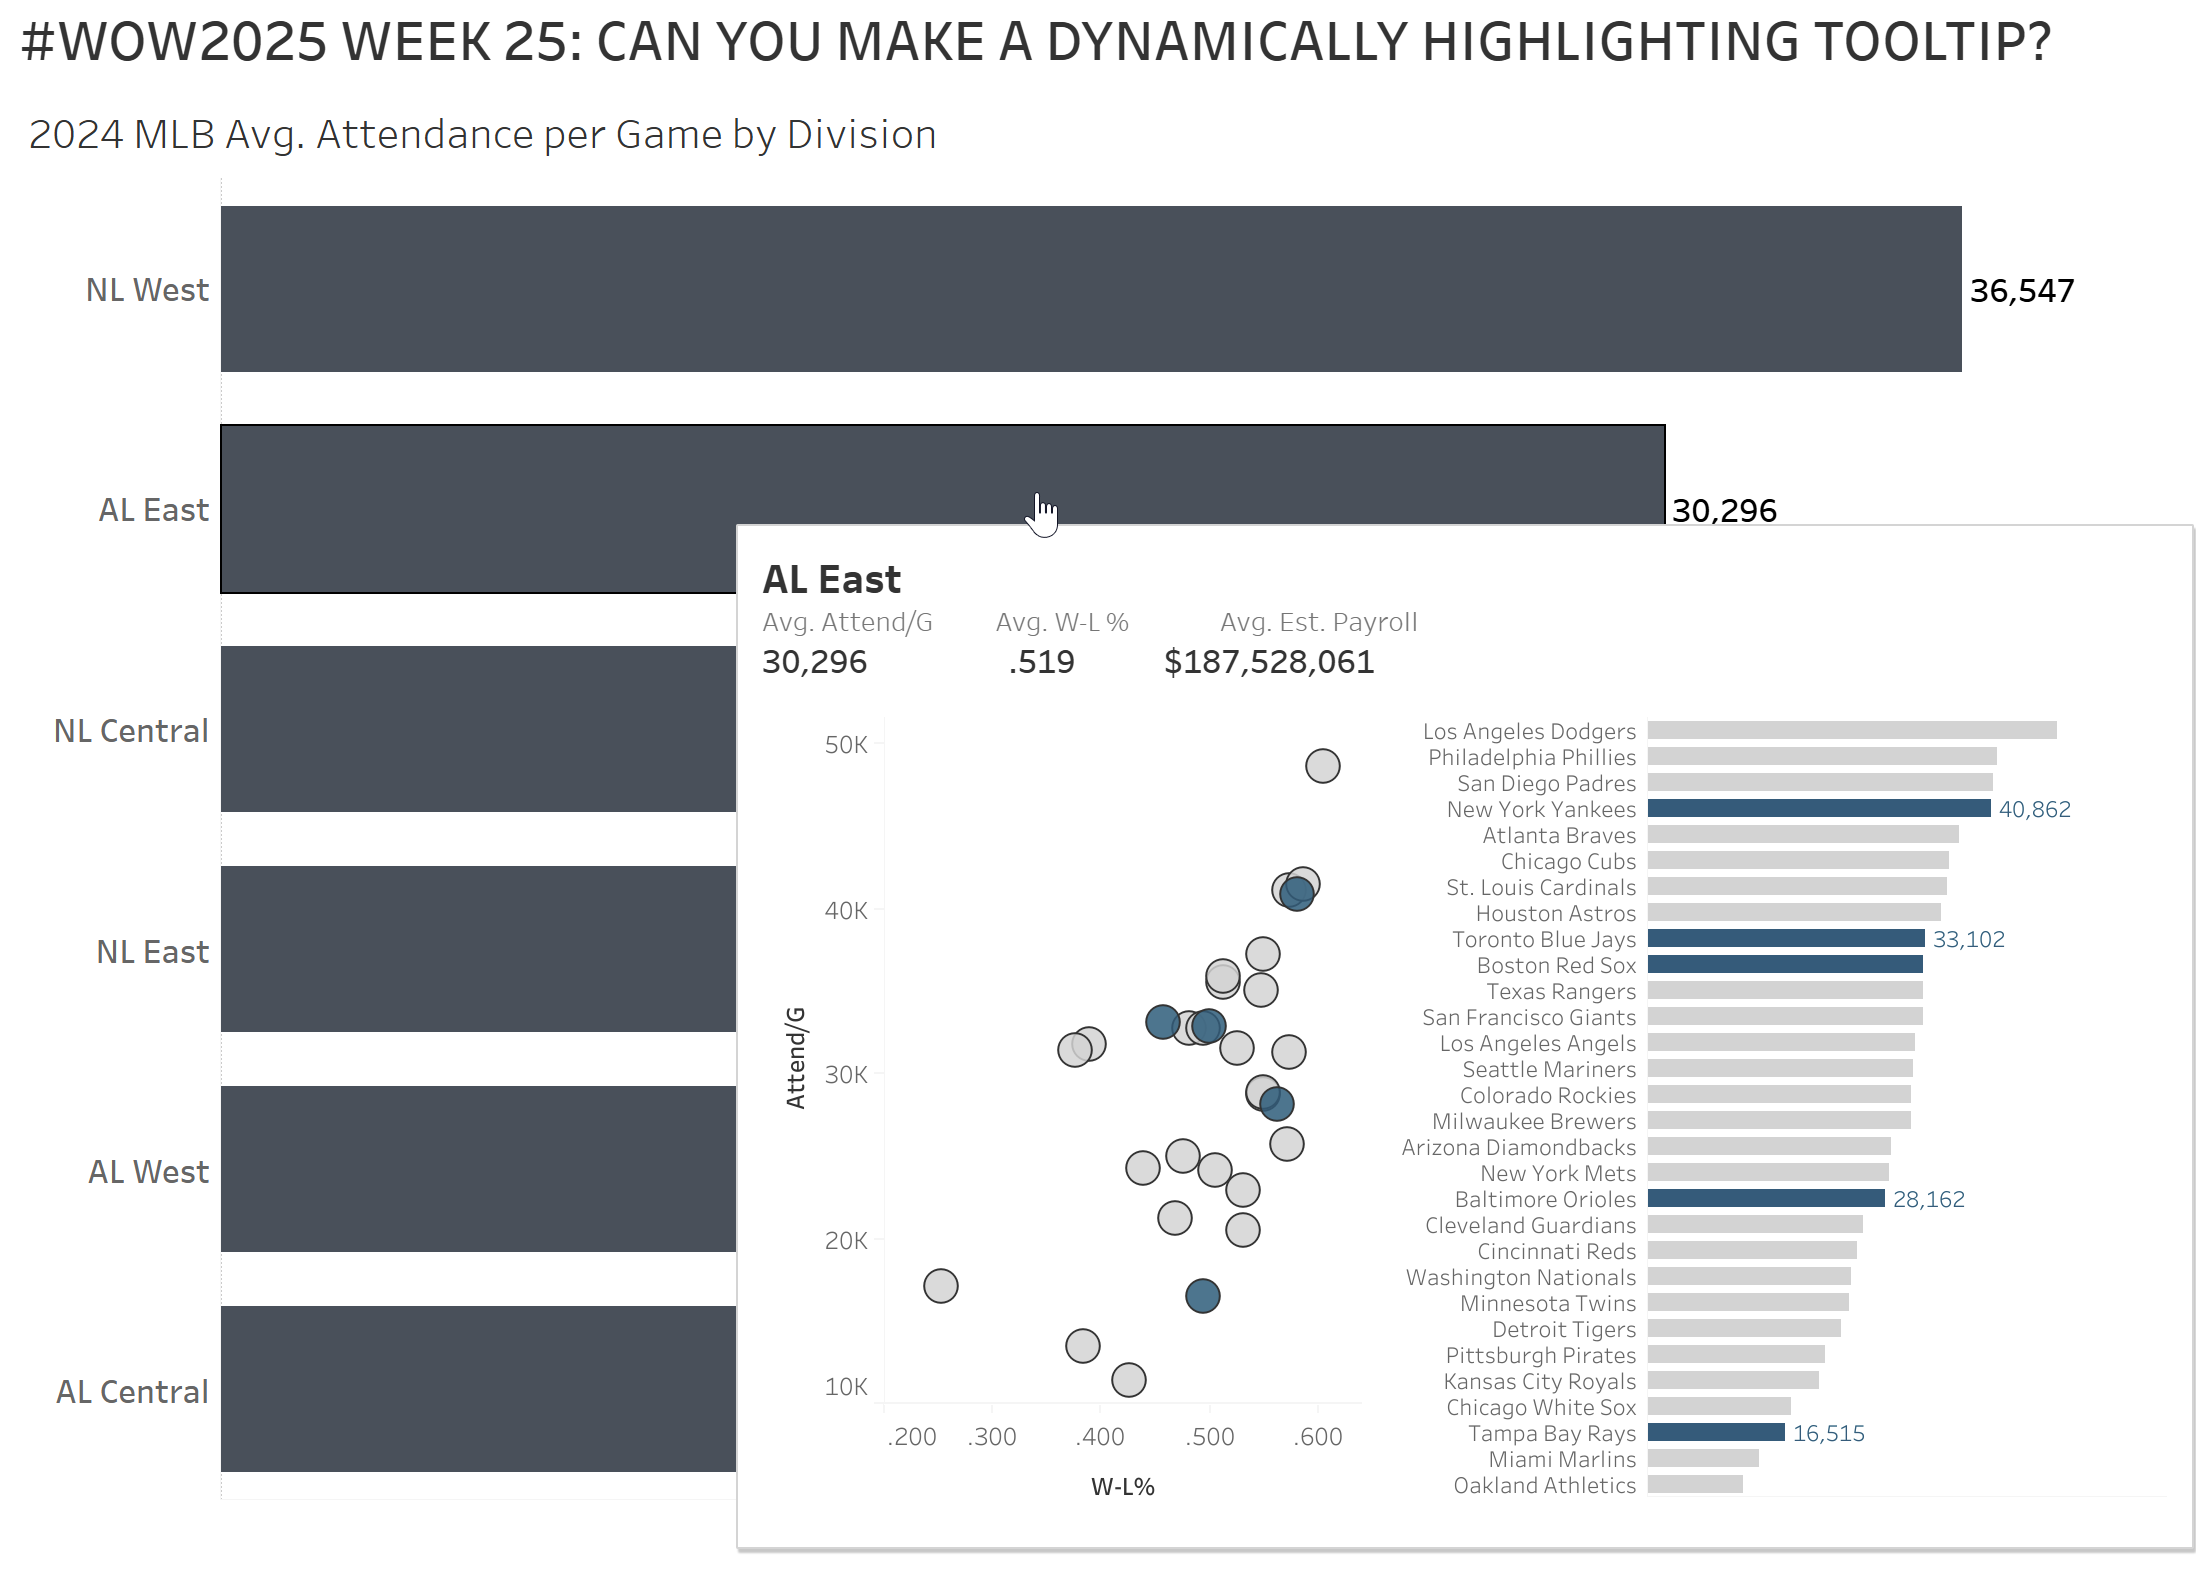
Build a bar chart showing Avg Attendance per game by Division
Create a scatterplot with Attendance/Game on Y axis and W-L% on X axis, with a circle for each team.
Create another bar chart showing the Attendance/Game for each team
Add those vizzes to the tooltip of the first bar chart, so that hovering on a Division bar will highlight the teams from that division in the vizzes in tooltip.
Dataset
Available from here. There are 3 tabs you’ll want to create relationships for in the data model.
Attribute
When you publish your solution on Tableau Public make sure to take the time and include a link to the original inspiration. Also include the hashtag #WOW2025 in your description to make it searchable!