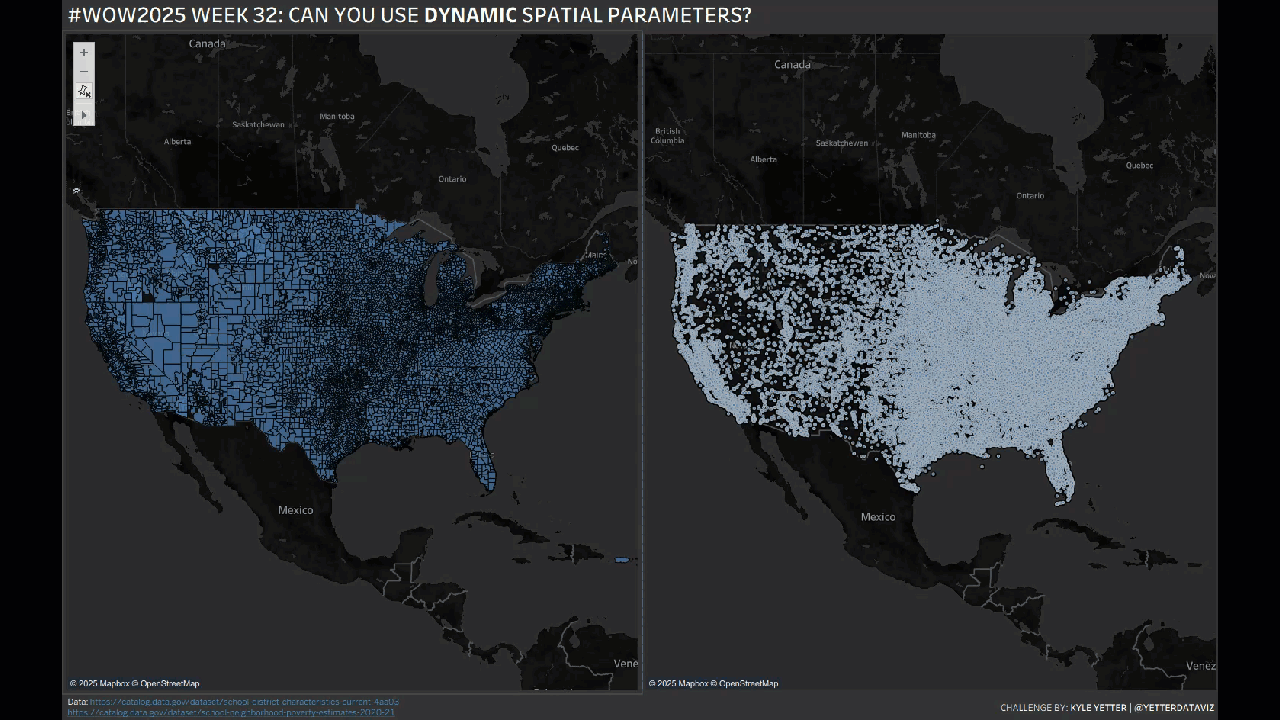
Tableau has released several spatial capabilities over the last year, and they continued that trend in 2025.2, adding dynamic spatial parameters, which allow you to filter data by map viewport, among other things.
We’ll go back to the US school data I’ve used for the other spatial challenges we’ve done this year, so this one will look similar to the Week 5 challenge, but the functionality will be different.
Create a dynamic spatial parameter using the district boundaries sheet as a Map Viewport, so as you zoom and move, the school locations sheet zooms and moves with it.
Dataset
This challenge uses two public datasets from data.gov. I downloaded the .zip Shapefiles from the School District Characteristics and School Neighborhood Poverty Estimates. (We’re not looking into the poverty status of school neighborhoods this time, just using this set for school location points.)
If you’re having trouble downloading from that site, you can try from Google Drive here and here.
Attribute
When you publish your solution on Tableau Public make sure to take the time and include a link to the original inspiration. Also include the hashtag #WOW2025 in your description to make it searchable!