Introduction
This week’s challenge is brought to you by yet another Guest Coach and active member of the Tableau and Workout Wednesday communities. Presenting, Giulio D’Errico!
Giulio proposed this challenge to me several weeks ago and we have worked together to build out his idea. This challenge applies some great fundamental skills, and then has a few interesting details for you as well.
Test yourself by seeing how many of the requirements you can complete! Don’t forget to tag us in your solutions.
A note from Giulio about the challenge:
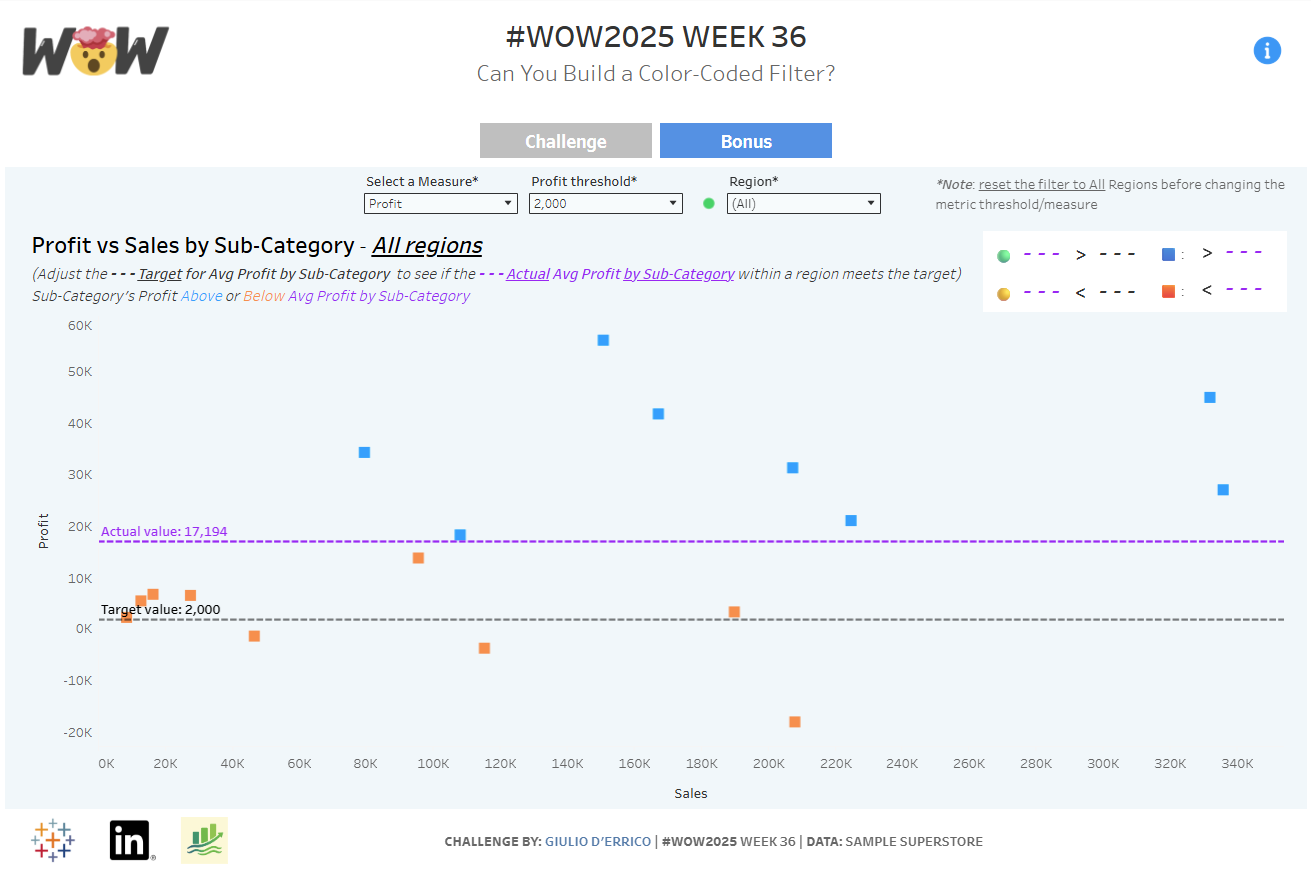
Create a Profit vs. Sales scatterplot by Sub-Category with dynamic, color-coded region filter that highlights whether each region meets a performance threshold (averaged by Sub-Category) based on the selected metric (Profit or Sales).
Requirements
- Dashboard size: 1200 x 800
- Create a scatterplot with Profit on Y axis and Sales on X axis, where each mark is a sub category
- Set up the following parameters to drive the logic:
- Measure selector → Sales or Profit
- Measure thresholds (apply based on the selected measure)
Sales Threshold → 20,000 , 25,000 , 30,000 , 42,000 , 50,000
Profit Threshold → 2,000 , 2,500 , 4,000 , 6,000 , 8,000
- Create reference lines (on the same axis as the selected measure) to visualize if a region meets the target
- measure threshold line (#000000, 50% opacity, dashed)
- average of the selected metric across Sub-Categories for the selected region(s) (#a020f0, dashed)
- Color the scatterplot to indicate if the selected metric in a Sub-Category is above (#009efa) or below (#ff9050) the regional average reference line across Sub-Categories (the purple dashed one)
- Filter by Region, customizing its label with color-coded flags (ensure they update based on selected measure and threshold):
- green (#00d26a; target achieved): region’s average across Sub-Categories ≥ measure threshold (purple line ≥ black line)
- yellow (#fcd53f; target NOT achieved ): region’s average across Sub-Categories < measure threshold (purple line < black line)
- Match tooltips and formatting
Bonus
- Dynamic Title
- Filter set to All → show All regions
- Single region filter → show region name (without the color-coded flag)
- Global Flag (additional sheet required; updates based on selected measure
and threshold)- Shown only when All is selected from the region filter
- green (#00d26a) if all regions are above threshold (all regions have a green flag within the filter)
- yellow (#fcd53f) if at least one region is below the threshold (there is at least one yellow flag within the region filter)
Dataset
This challenge uses Sample Superstore data (2024 version) with no filters applied. You can find the data source on Data.World
Attribute
When you publish your solution on Tableau Public make sure to take the time and include a link to the original inspiration. Also include the hashtag #WOW2025 in your description to make it searchable!

Share
After you finish your workout, share your solution:
- On Twitter using the hashtag #WOW2025 #Tableau and tag @WorkoutWednsday, and @_hughej
- On LinkedIn using the tag Workout Wednesday, Tableau, Giulio D’Errico and Erica Hughes
Solution
Interactive
