Introduction
This week we’re going easier than typical. We’re going back to the basics. We’re going to practice our Table calculations in a simple easy dashboard. If you wanna take it up a notch, feel free but this week is keeping it simple.
So here go! Let’s practice Table Calcs
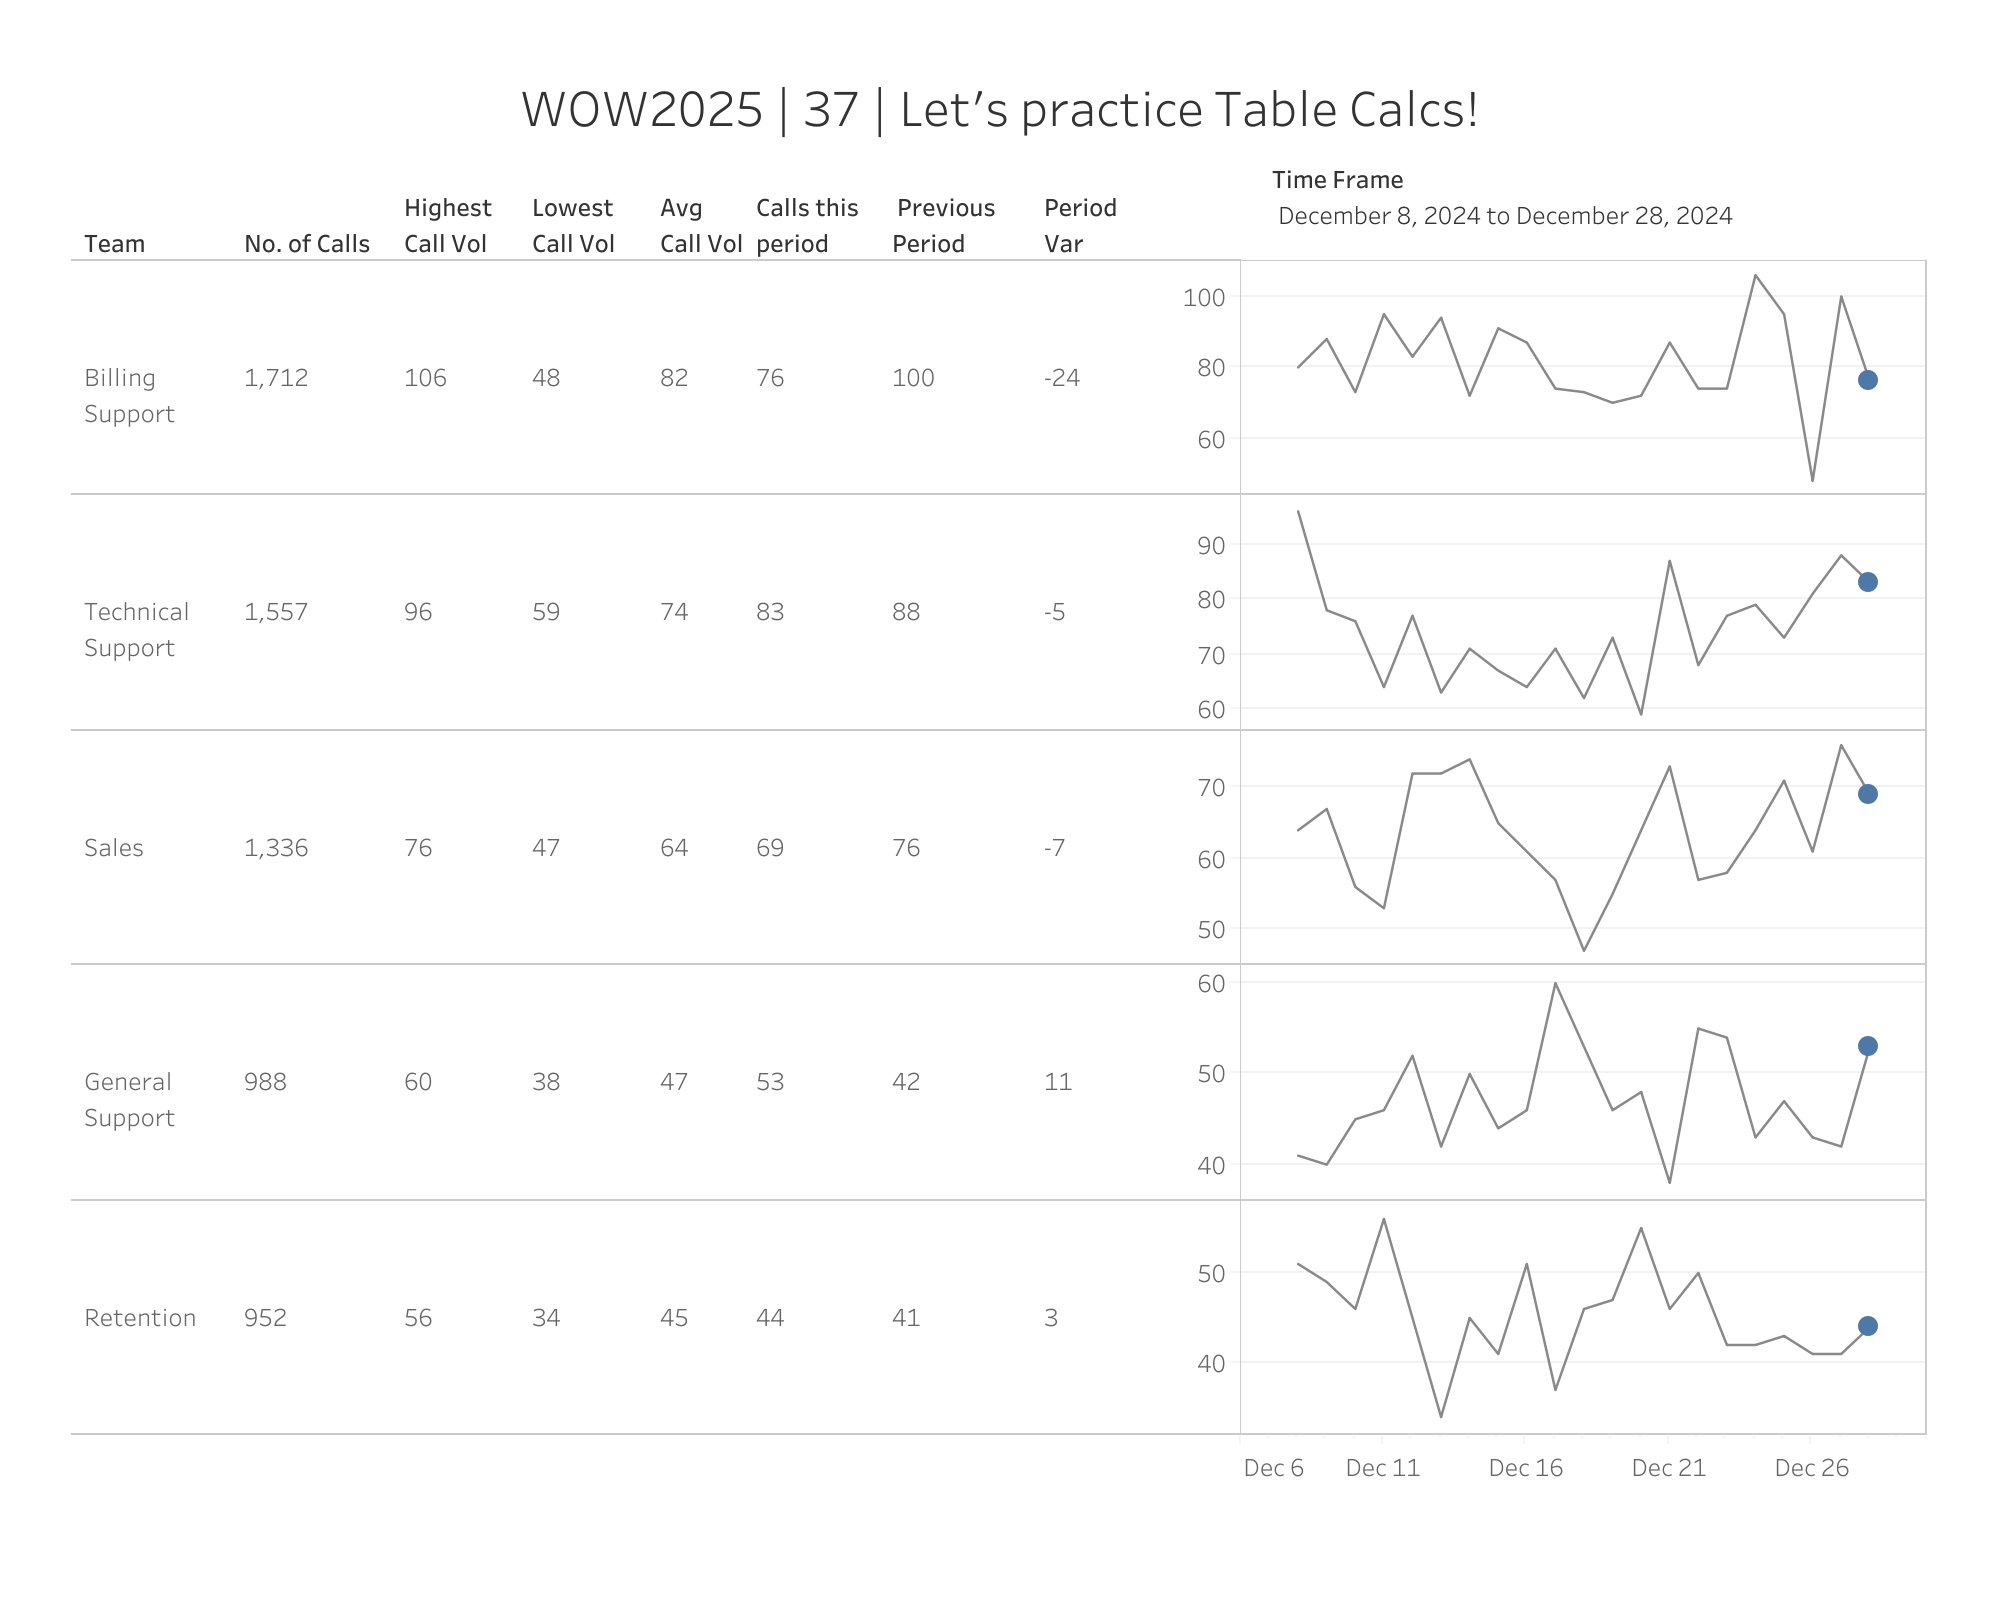
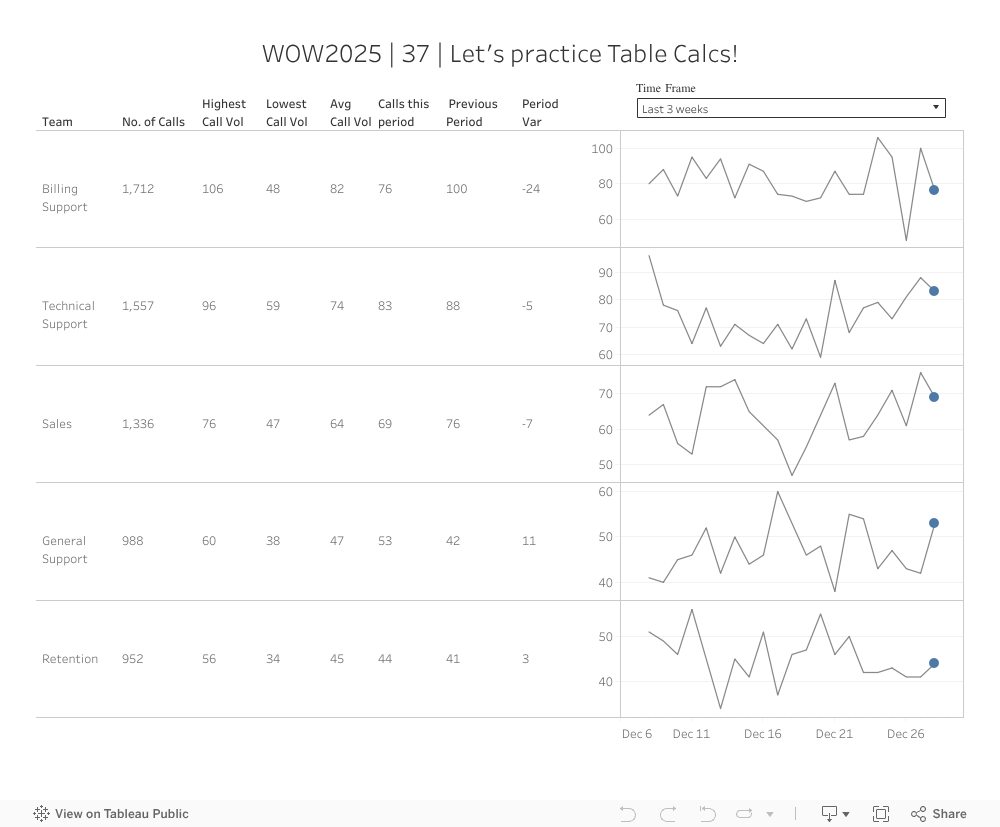
This week’s challenges highlights data from Season 4 of #RWFD featuring Call Center data.
Requirements
- Make a sparkline chart by team visualizing Daily Call Volume
- And a single mark at the end of the sparkline showing the most recent number of calls
- In addition to the sparkline let’s add the following metrics
- Total Number of calls during the selected time frame
- Highest number
- Lowest number
- Avg number
- Most recent period
- Previous Period
- Variance between Most Recent and Previous Periods
Dataset
Available from here.
Attribute
When you publish your solution on Tableau Public make sure to take the time and include a link to the original inspiration. Also include the hashtag #WOW2025 in your description to make it searchable!

Share
After you finish your workout, share on Twitter and/or LinkedIn using the hashtag #WOW2025 #Tableau and tag @WorkoutWednsday