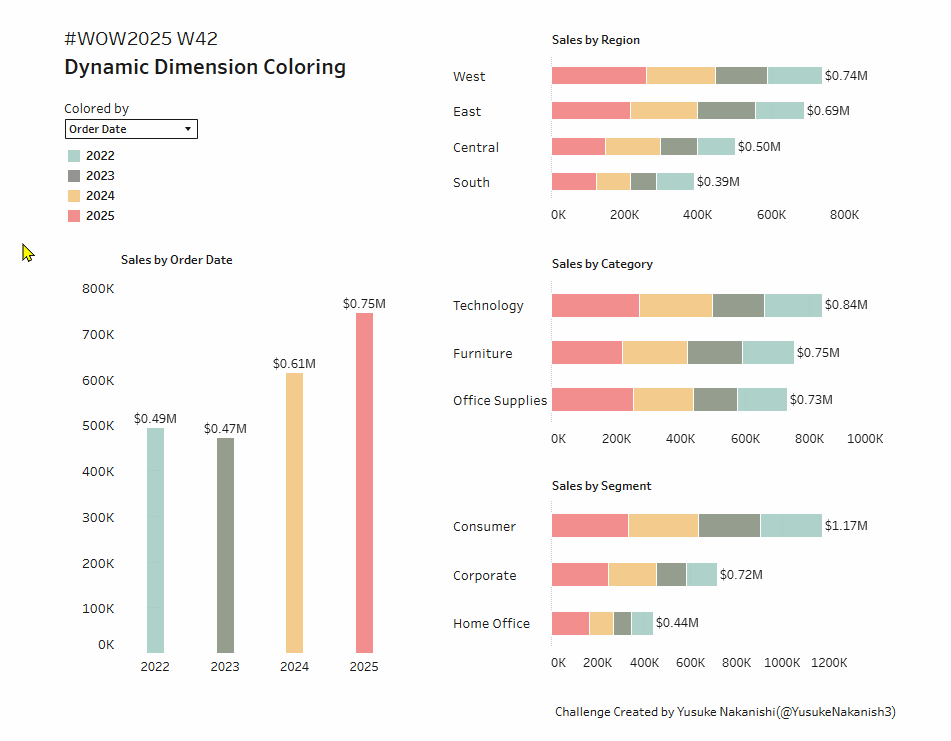
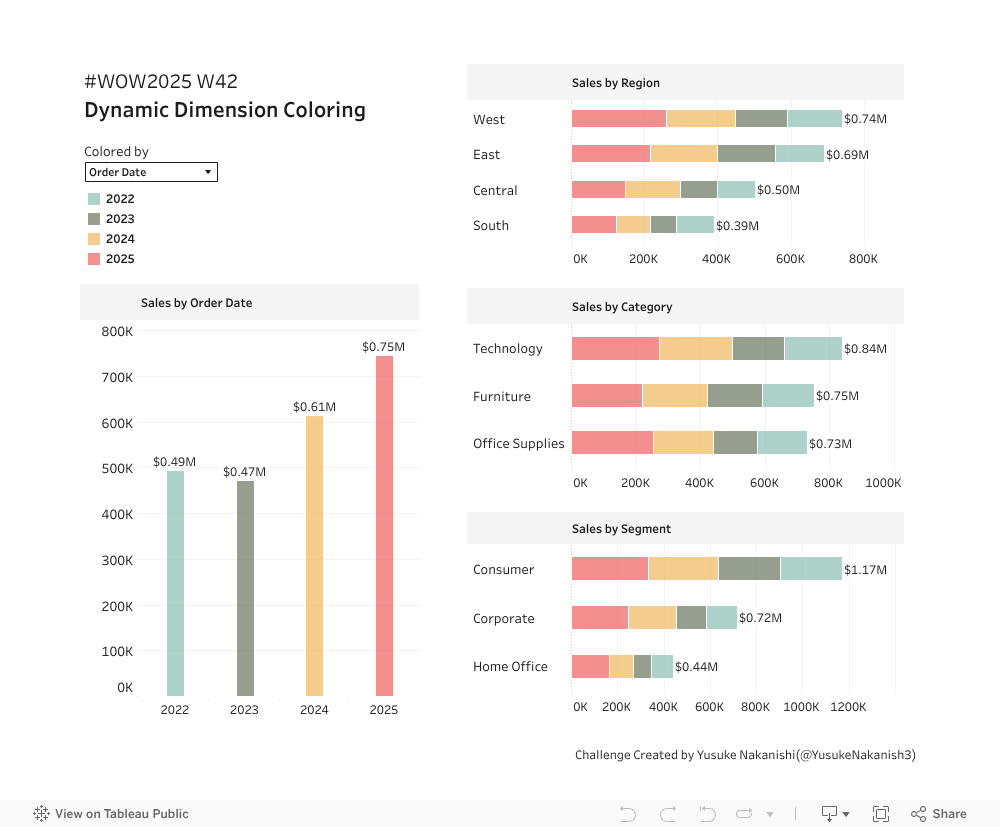
I recently received a business request with the following requirements:
The user wants to easily change the dimension that colors the charts on a dashboard.
The list of dimensions might be added or removed in the future, so the solution needs to be simple and easy to maintain.
This week’s challenge is inspired by that request. While I’ve added a few extra elements to make it a proper workout, the core coloring functionality is based on that simple premise. Have fun!
Create bar charts showing the total sales for the following four dimensions:
Year of Order Date
Region
Category
Segment
Create a way for the user to select a dimension and have all four charts be colored by that selected dimension.
The total sales label must always be displayed at the end of each bar.
The label should show the percentage of total sales for that mark upon hovering.
Match the tooltips and formatting.
Feel free to choose your own color palettes for each dimension.
Dataset
This challenge users Sample Superstore 2025.2 data. You can download the data here.
Attribute
When you publish your solution on Tableau Public make sure to take the time and include a link to the original inspiration. Also include the hashtag #WOW2025 in your description to make it searchable!