A huge thank you to Valerija Kirjackaja for her continued support as guest coach. This week I had an idea that I didn’t have time to test and implement, due to other life priorities, so I feel very grateful to be able to lean on the people around me for support.
This feels like a real Valerija classic, so if you’ve been around for a few years you may have already picked up a few of her tricks!
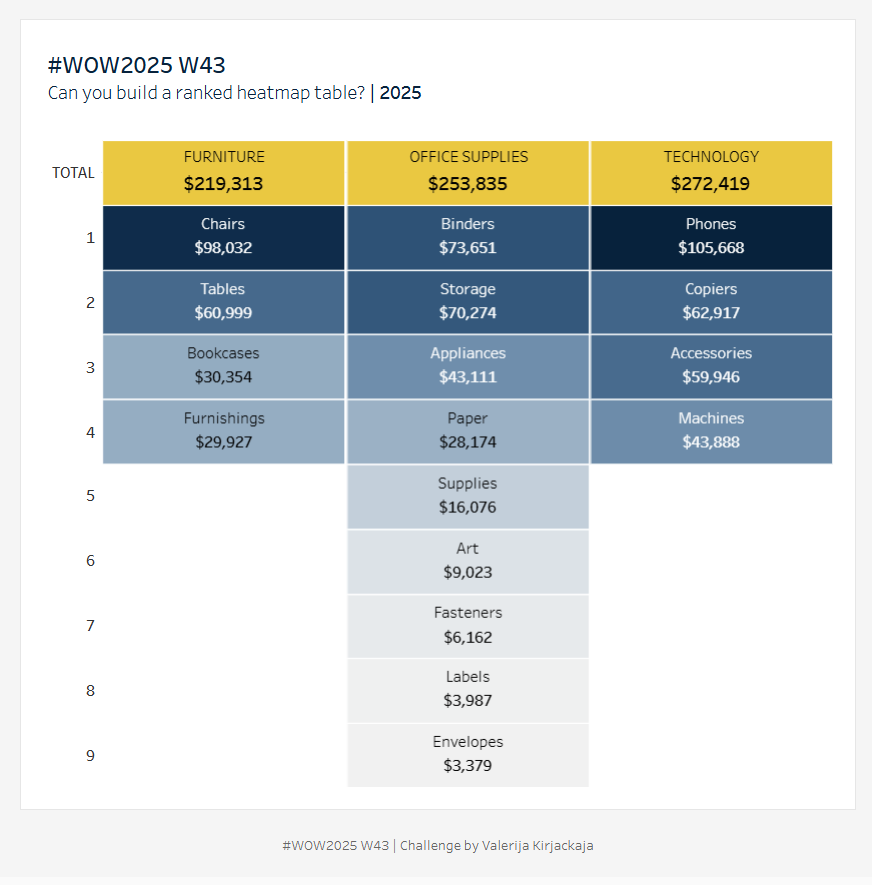
Two sheets (1 for the table and 1 for the tooltip)
Filter everything to a single year (2025 or the max year in your data)
In the heatmap, show the sales by Sub-Category within each Category, ranked from highest to lowest.
Colour by Sales
Show Category totals at the top
When hovering over a Sub-Category, show how that Sub-Category compares against others in the same Category
Match formatting
Dataset
This challenge uses Sample Superstore data (2025 version) with no filters applied. You can find the data source on Data.World
Attribute
When you publish your solution on Tableau Public make sure to take the time and include a link to the original inspiration. Also include the hashtag #WOW2025 in your description to make it searchable!
Share
After you finish your workout, share your solution: