Introduction
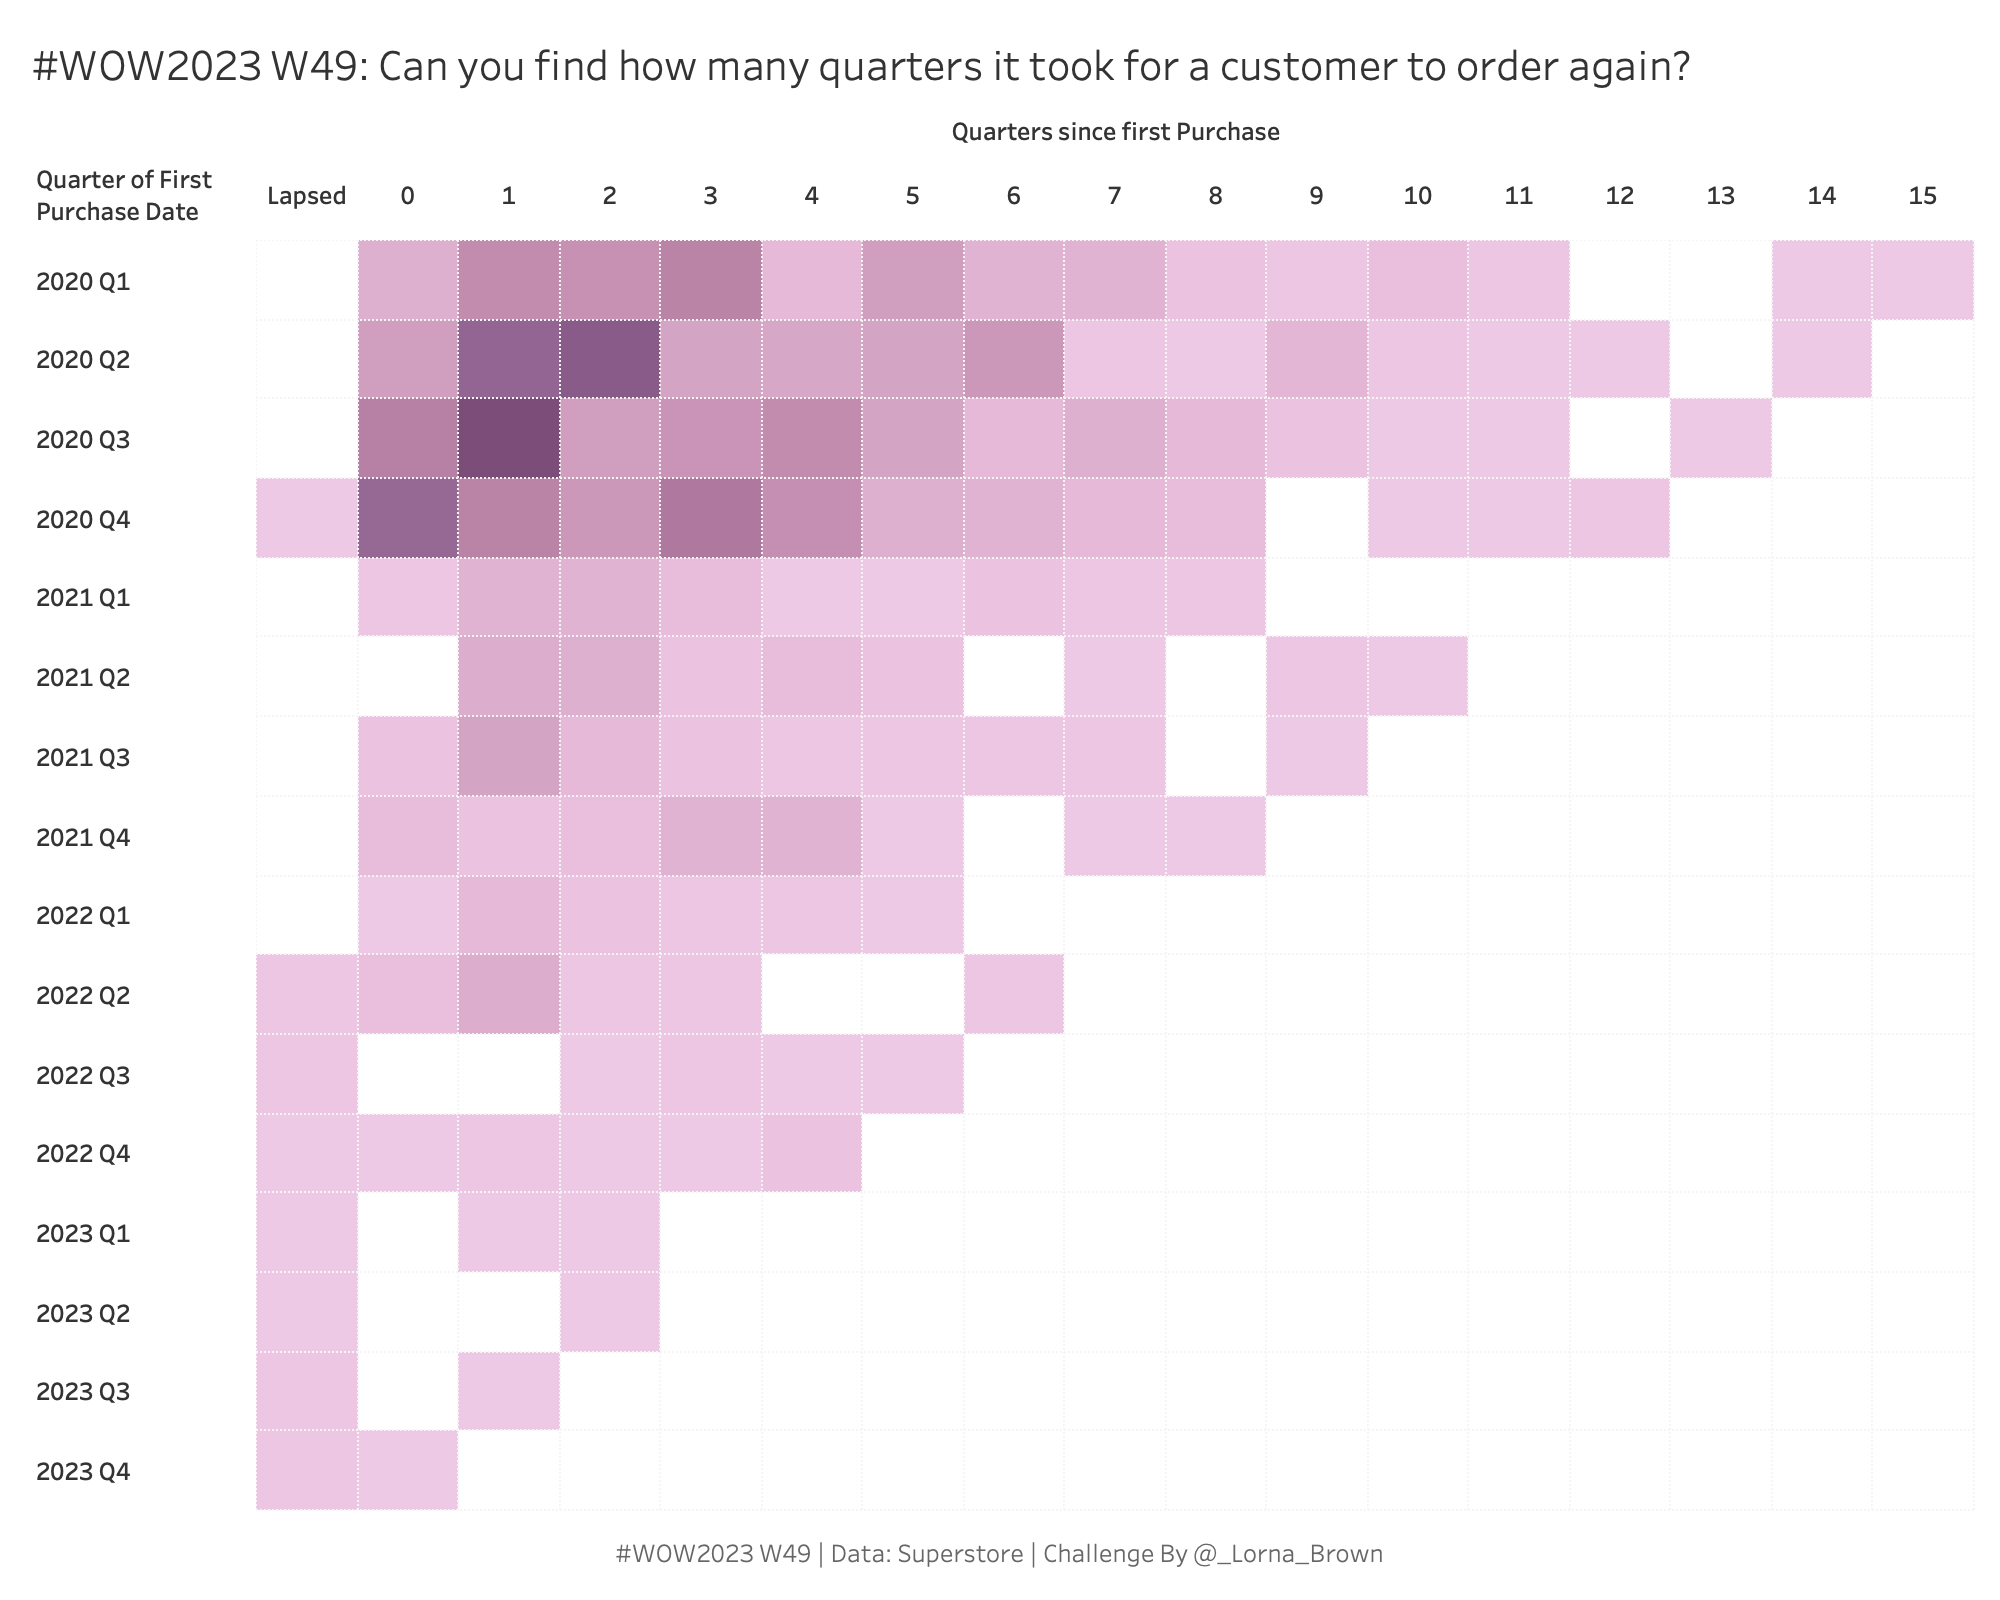
This week I wanted an easier challenge in the lead up to the Christmas Holidays. So what better way than doing some Level of Detail calculations. I want you to be able to find out how many quarters it took for a customer to make their second purchase
Requirements
- Dashboard Size: 1000 x 800px
- 1 sheet
- 2 LOD’s needed
- Create a matrix that shows the quarter and year of the customers first purchase
- Followed by the number of quarters it took to make their second purchase
Dataset
This week uses Superstore data set. You can find it here on Data.World
Attribute
When you publish your solution on Tableau Public make sure to take the time and include a link to the original inspiration. Also include the hashtag #WOW2023 in your description to make it searchable!

Share
After you finish your workout, share on Twitter and/or LinkedIn using the hashtag #WOW2023 #Tableau and tag @WorkoutWednsday
