Introduction
Welcome to Week Fourteen! This week, you’re going to learn about Sigma’s Lookup function. Lookups are very useful for joining information from one data source to another, without accidentally fanning your data. Sigma also has a Lookup Wizard for a foolproof way of utilizing this function.
When I book a flight, I am particularly concerned with the likelihood my flight will arrive delayed and negatively impact my travel plans. In this challenge, you will employ Lookup functions to visualize Flight Delay data in the year 2015 to explore how different factors could affect your next vacation. I encourage you to utilize the Lookup wizard, as well as testing writing a function on your own.
As a bonus, you will also get to use a couple of Sigma functions that find the names of month and weekdays, instead of manually hardcoding a Switch or Choose function.
Good Luck!
-Ashley
Need access to Sigma?
Note: You will only have view access to WOW Workbooks, Folders, and Workspaces, not edit access. Please create your WOW Workbooks under “My Documents.” We suggest creating a folder to organize all your workbooks.

Requirements
- Add three data elements from the FAA schema
- Sigma Sample Database > Fun > FAA
- Flights: This will be the source of your visualization
- Note the various Metrics available on this source
- Airlines & Airports: These tables will be used to Lookup Data
- Flights: This will be the source of your visualization
- In the Airlines & Airport Tables: Create calculated columns that replace common words with empty spaces in Airline and Airport names.
- This will reduce the space used in the bar graph axis
- Hint: I replaced “Inc.” and “Co.” in Airline Name. I also replaced “Airport” and “International” in Airport Names. You can do as much or as little as you feel is necessary.
- In the Flights table:
- Add appropriate Lookups to find Airline Name, Origin Airport, and Destination Airport. Be sure your columns have unique and descriptive names.
- Add columns for the MonthName and WeekdayName
- Hint: Use the date part columns to make a Flight Date to utilize the Sigma functions that find these names
- Hide the Data Tab
- Sigma Sample Database > Fun > FAA
- On a visible page:
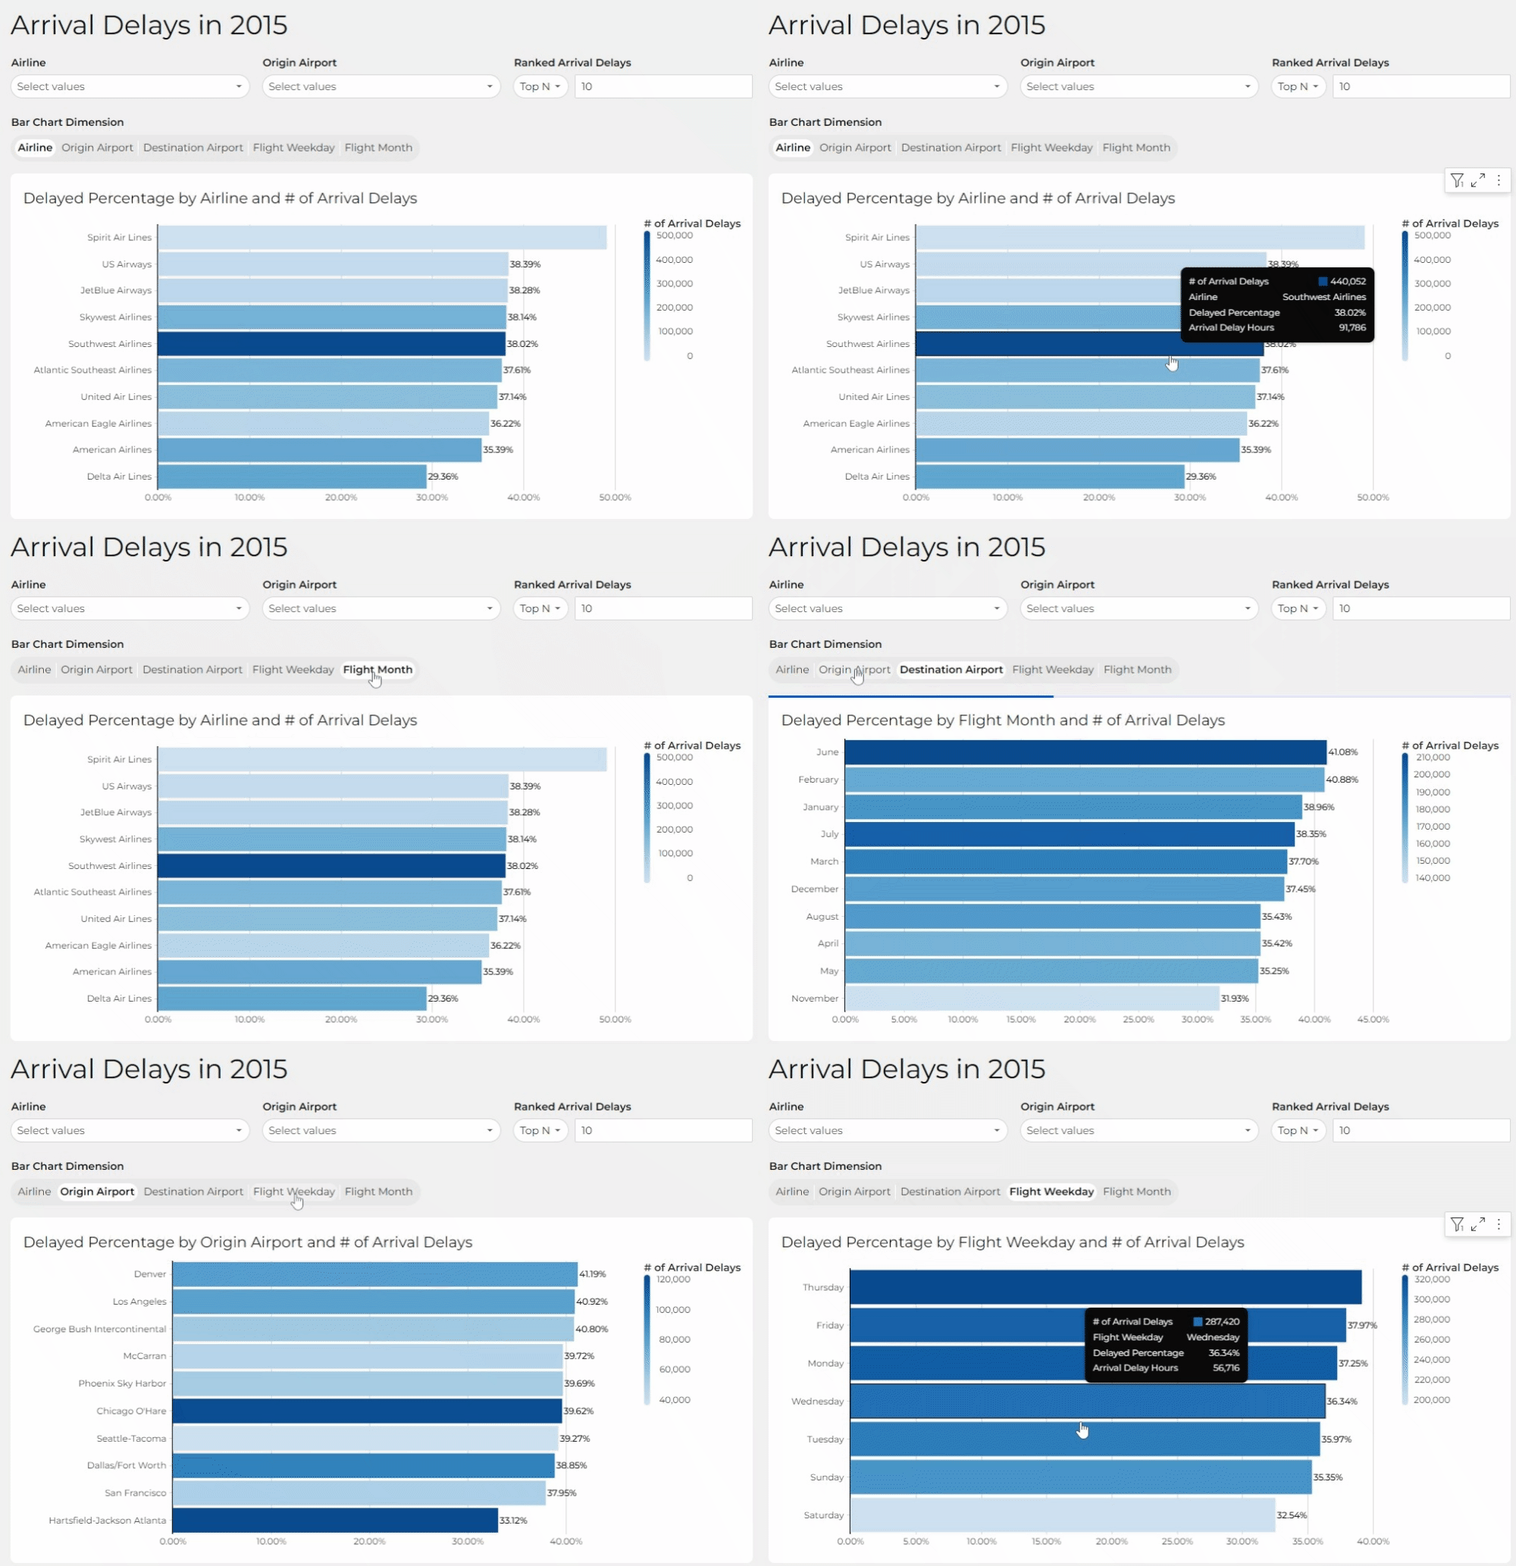
- Create a horizontal Bar Graph:
- Y-Axis: Airline
- X-Axis: Delayed Percentage (visible) & Delayed Percentage Weighted (hidden)
- Delay Percentage is the actual rate of delayed flights, which is what we are most interested in seeing here
- Delay Percentage Weighted accounts for the number of flights the dimension had, making it ideal for filtering in this case.
- Color by Scale: # of Arrival Delays
- ToolTip: Arrival Delay Hours
- Formatting Requirements:
- Show the Legend Header and change the column name to take less space in your graph
- Show Total Data Labels
- Sort the Bar Graph by Delay Percentage descending
- Add 4 Page Controls for user interaction:
- Airline
- Origin Airport
- Ranked Arrival Delays
- Top N
- Target Column: Delayed Percentage Weighted
- Bar Chart Dimension (Drill Down)
- Airline
- Origin Airport
- Destination Airport
- Flight Weekday
- Flight Month
- Add an informative title
- Arrange your elements into a simple dashboard
- Create a horizontal Bar Graph:
Dataset
Sigma Sample Database > Fun > FAA
Share
After you finish your workout, share on LinkedIn, Sigma’s Community page, (or Twitter) using the hashtags #WOW2024 and #SigmaComputing, and tag Ashley Bennett, Eric Heidbreder, and Katrina Menne!
Create an interactive, sharable version of your solution here.
Also, make sure to fill out the Submission Tracker so that we can count you as a participant this week to track our participation throughout the year.