Introduction
This weeks challenges come from a fellow Data School Coach, Robbin Vernooij. He created this back in 2019, but I thought it was a pretty cool dashboard and gets you to think about Sets in a good way!
Requirements
- Dashboard Size 1000×800
- Connect the data together
- You can choose to pivot or just keep the 2022 year
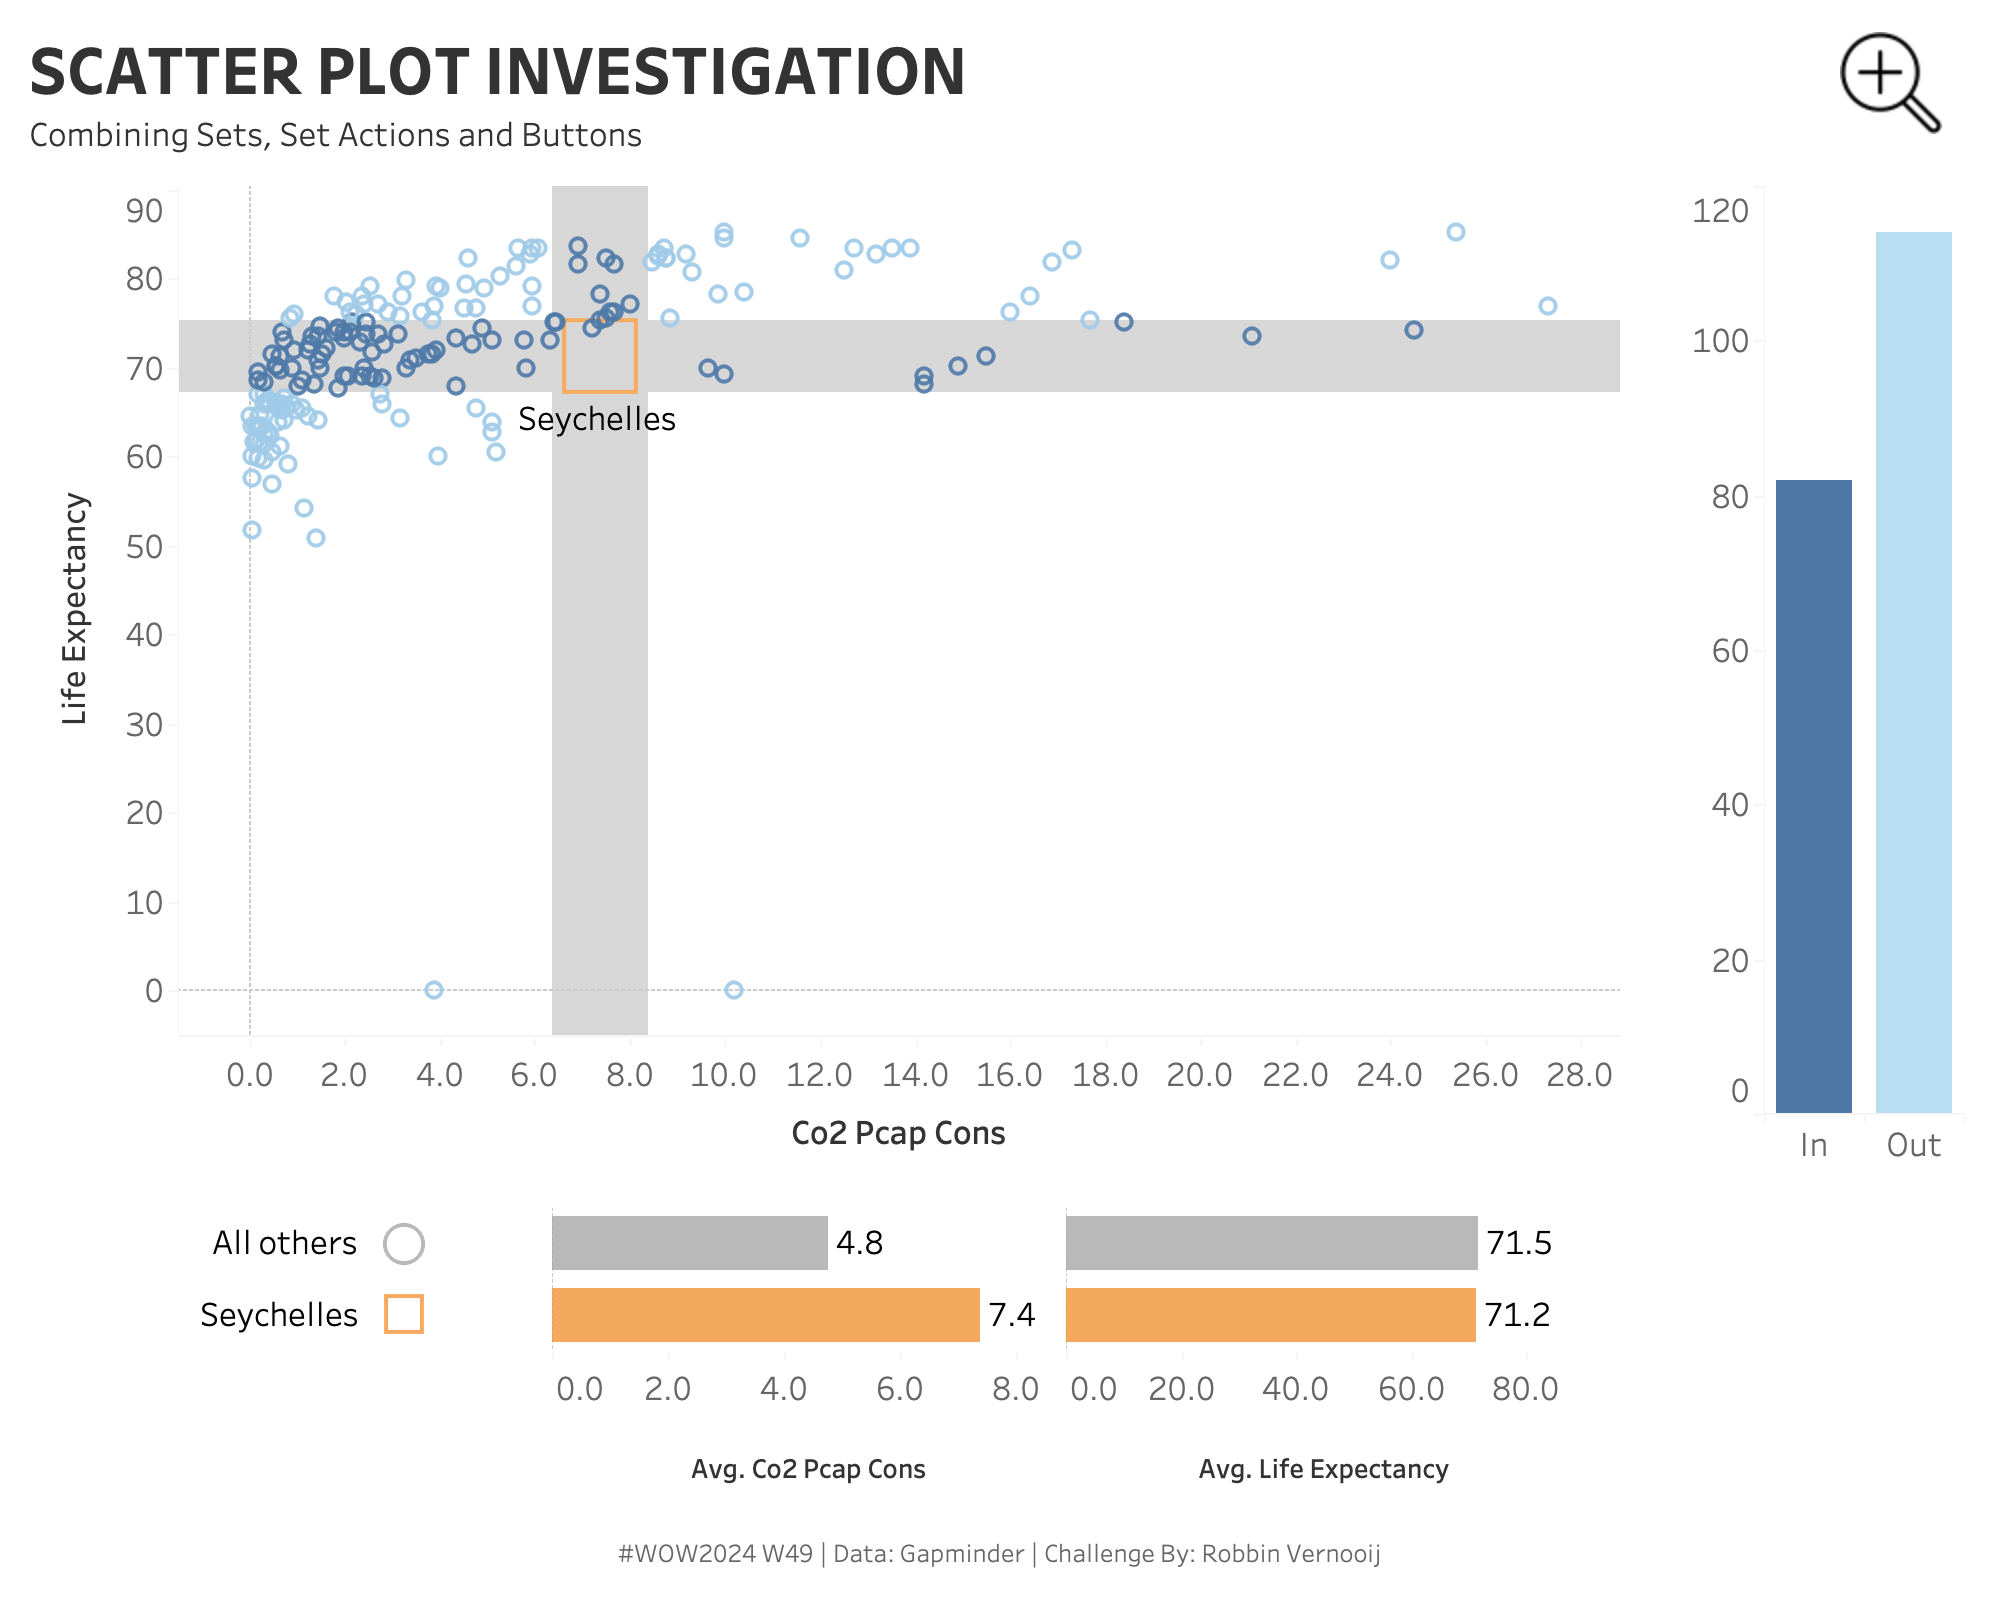
- Create a Scatter plot showing all countries for both metrics
- Create a reference band around the selected country
- Show Selected Country vs the Average of all the other countries
- Show how many countries sit within the reference bands
EXTRA
- Create an information overlay sheet
Dataset
This challenge uses data from GapMinder, but can be downloaded here
Attribute
When you publish your solution on Tableau Public make sure to take the time and include a link to the original inspiration. Also include the hashtag #WOW2024 in your description to make it searchable!

Share
After you finish your workout, share on Twitter and/or LinkedIn using the hashtag #WOW2024 #Tableau and tag @WorkoutWednsday
