Introduction
Welcome to Week 45 of 2025!
This week we have two guest authors: Nick Haylund and Thomas Larsen!
A lot of data folks have heard about the Waffle House Index being used as a disaster indicator for FEMA. Linked there is one of the first, and quite comprehensive, Medium articles we could find on the subject. Summer Whitford describes how, for Waffle House, “business continuity and disaster planning are just as essential to operations as serving hot food fast and developing deep ties to local communities. Over the years, Waffle House restaurants have become reliable indicators of the level of destruction or disruption of vital services like water, gas, and electricity. This has earned them a reputation as a gauge of the severity of a disaster that government relief agencies rely on.”
It was in 2004 that Craig Fugate developed this unique theory about indicators for assessing recovery after a hurricane, starting to use Waffle Houses to measure how quickly a community and its economy could get up and running after a disaster.
So, for this week’s challenge, let’s build out a dashboard in Sigma, blending weather data with Waffle House locations, to gauge which Waffle Houses might be FEMA’s first call when there’s severe weather in October.
In this Sigma challenge, analyze weather actuals for all Waffle House locations across the continental United States during October 2025. Your goal is to reshape raw weather pulls into an analysis-ready format and build a view that highlights weather exposure by state, and by store. We’ll use data sourced from SkySparq, and focus on weather and locations only. You’ll be able to source the data using the SkySparq connector on Snowflake Marketplace, or using the flat file found at data.world. Preparing this data correctly will make it easy to blend any store or locations’ data for any future weather analysis.
Good luck!
-Nick and Thomas
Need access to Sigma?
Note: You will only have view access to WOW Workbooks, Folders, and Workspaces, not edit access. Please create your WOW Workbooks under “My Documents.” We suggest creating a folder to organize all your workbooks.
Requirements
- Ingest data source
- Connect to Waffle Location Join dataset in the Sigma WoW workspace
- Alternative 1: use raw data via SkySparq connection, join to the Waffle House Locations, to expand the data to be more than October 2025
- Alternative 2: grab the dataset at world
- Once load, transpose the data (label elements as Measurement, the values as Value)
- Keep data table at bottom of the Workbook
- Workbook settings Theme = Dark
- Image header: BuildingTheWaffleHouseIndex.png
- Colors:
- Yellow color (Titles, Trend for KPI charts) = #FEDF17
- White color = #FFFFFF
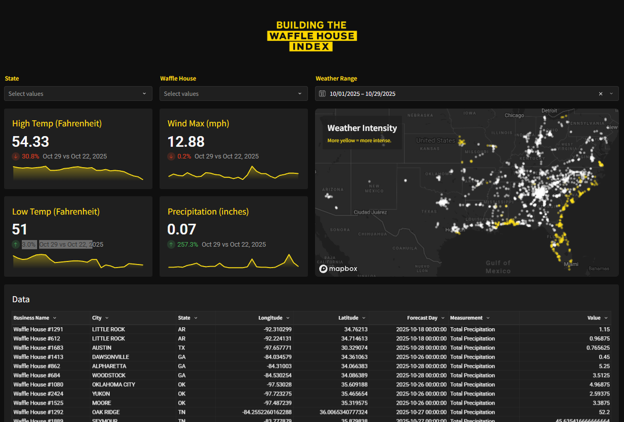
- Create 4 KPI charts, comparing week over week readings:
- High Temp (convert from Celsius to Fahrenheit with calculation)
- Low Temp (convert from Celsius to Fahrenheit with calculation)
- Wind Max (convert from meters per second to mph with calculation)
- Precipitation (convert from millimeters to inches with calculation)
- Create Map:
- Chart Type = Map – Geography
- Create Poly (point) for geography with MakePoint([Longitude], [Latitude])
- Format:
- Map Style = Dark
- Reflectivity will be the Map’s Value to indicate weather intensity for the time-range
- If([Measurement] = “Max Reflectivity”, [Value])
- Format Point Size = 3
- Opacity = 50%
- Choose Median as aggregate for Value
- Color or points’ value should be a custom diverging range of Min = 15, Middle = 25, Max = 35
- 5 = 0 white; #FFFFFF
- 25 = grey; #D4D4D4
- 45 = yellow; #FEDF17
- Details:
- 0–5: Clear skies or very light clouds, little to no precipitation
- 25–34: Moderate rain or mixed precipitation
- 40–45: Heavy rain or strong storms
- 50+: Very intense storms or hail
- Add Filters as Controls to apply to data:
- State
- Waffle House (Business Name)
- Weather Range (Forecast Day)
- Connect to Waffle Location Join dataset in the Sigma WoW workspace
Dataset
- Workout Wednesday > 2025 > 2025W45 – Waffe House Index > Weather Location Join
Share
After you finish your workout, share on LinkedIn, Sigma’s Community page, (or Twitter) using the hashtags #WOW2024 and #SigmaComputing, and tag Ashley Bennett, Eric Heidbreder, Jess Batten, Carter Voekel, and Michal Shaffer!
Create an interactive, sharable version of your solution here.
Also, make sure to fill out the Submission Tracker so that we can count you as a participant this week to track our participation throughout the year.
Solution
Coming Soon…