Following last week’s challenge, we’re continuing with the Bar Chart Race theme — but this time, it’s more advanced! Last time, we created a basic Bar Chart Race, but because we used monthly data, the animation movement was somewhat discrete.
This week’s challenge takes it to the next level by using Data Densification and table calculations to interpolate data points between months, creating a smoother and more fluid animation.
It might not be the most practical exercise, but sometimes it’s nice to have a challenge that’s all about fun and creativity, right? I hope you enjoy!
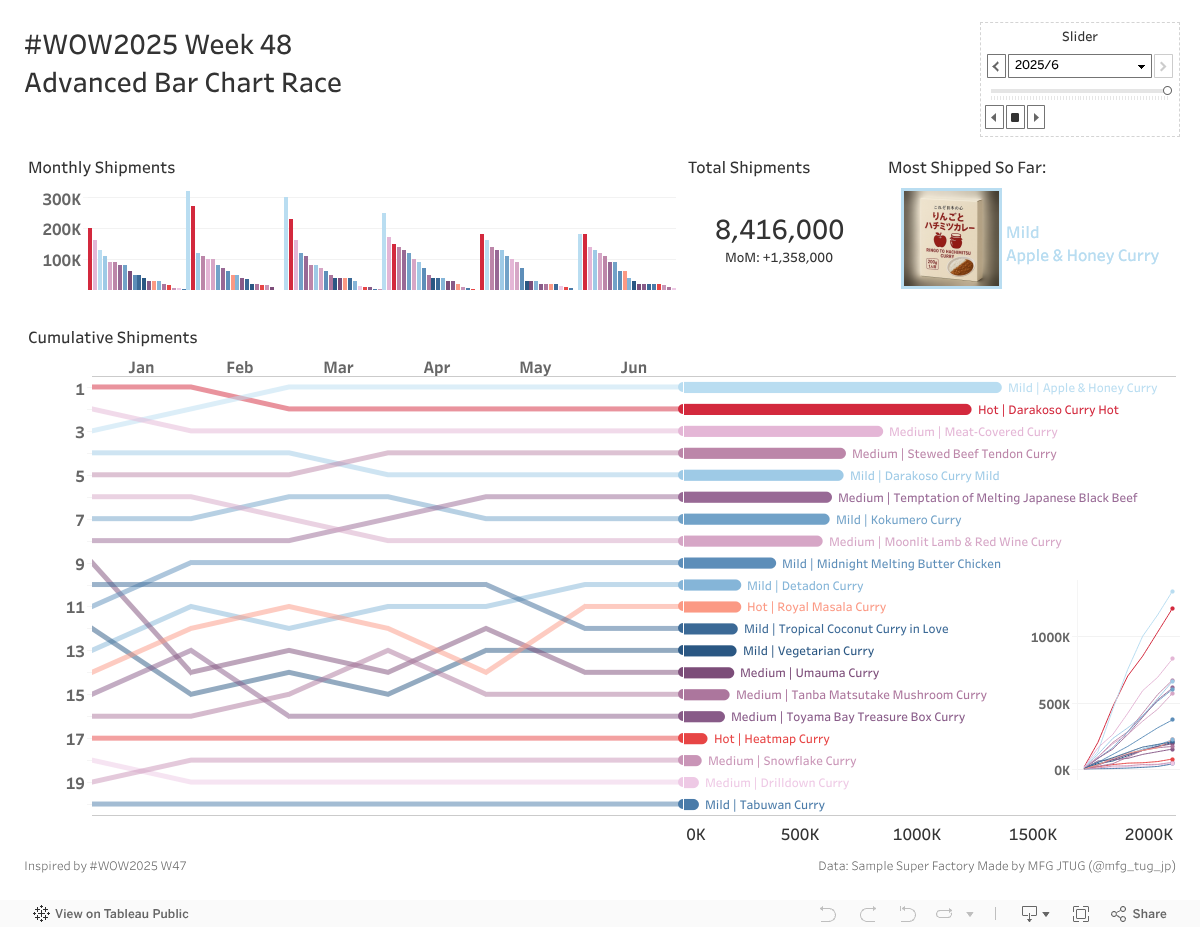
All sheets should dynamically update based on the slider selection
Filter data to January through June 2025
Display the followings:
Monthly Shipments bar chart by product displaying monthly shipment data
Total Shipments showing cumulative shipments for the entire period and MoM (Month over Month) change
Most Shipped So Far section displaying the image and name of the most shipped product
A Bump Chart chart displaying cumulative shipment ranks aligned with each month
A Bar Chart Race showing how product rankings change over time based on cumulative shipment
Products dynamically change position based on their ranking
Display product name and spice level at the right end of each bar
Include a mini chart in the bottom right showing the cumulative value progression
Color-code by spice level and product name
Match tooltips as closely as possible
Dataset
This challenge uses a translated subset of Sample Super Factory dataset made by MFG JTUG (@mfg_tug_jp) and dummy data for data densification. You can download the data here (Google Drive).
Attribute
When you publish your solution on Tableau Public make sure to take the time and include a link to the original inspiration. Also include the hashtag #WOW2025 in your description to make it searchable!