This week, Agentforce World Tour Tokyo is being held in Japan! As one of the many sessions from DataFam, Workout Wednesday will be holding its first-ever live session in Japan!
For this special occasion, With Yoshi and other supporters from the Japanese Workout Wednesday enthusiasts have created a fun, quick challenge themed around a Bar Chart Race.
We are using the Sample Super Factory dataset, an educational dataset for the manufacturing industry, created by the Japan Tableau User Group for Manufacturing (MFG JTUG @mfg_tug_jp).
All sheets should dynamically update based on the slider selection Filter data to 2025
Display the followings:
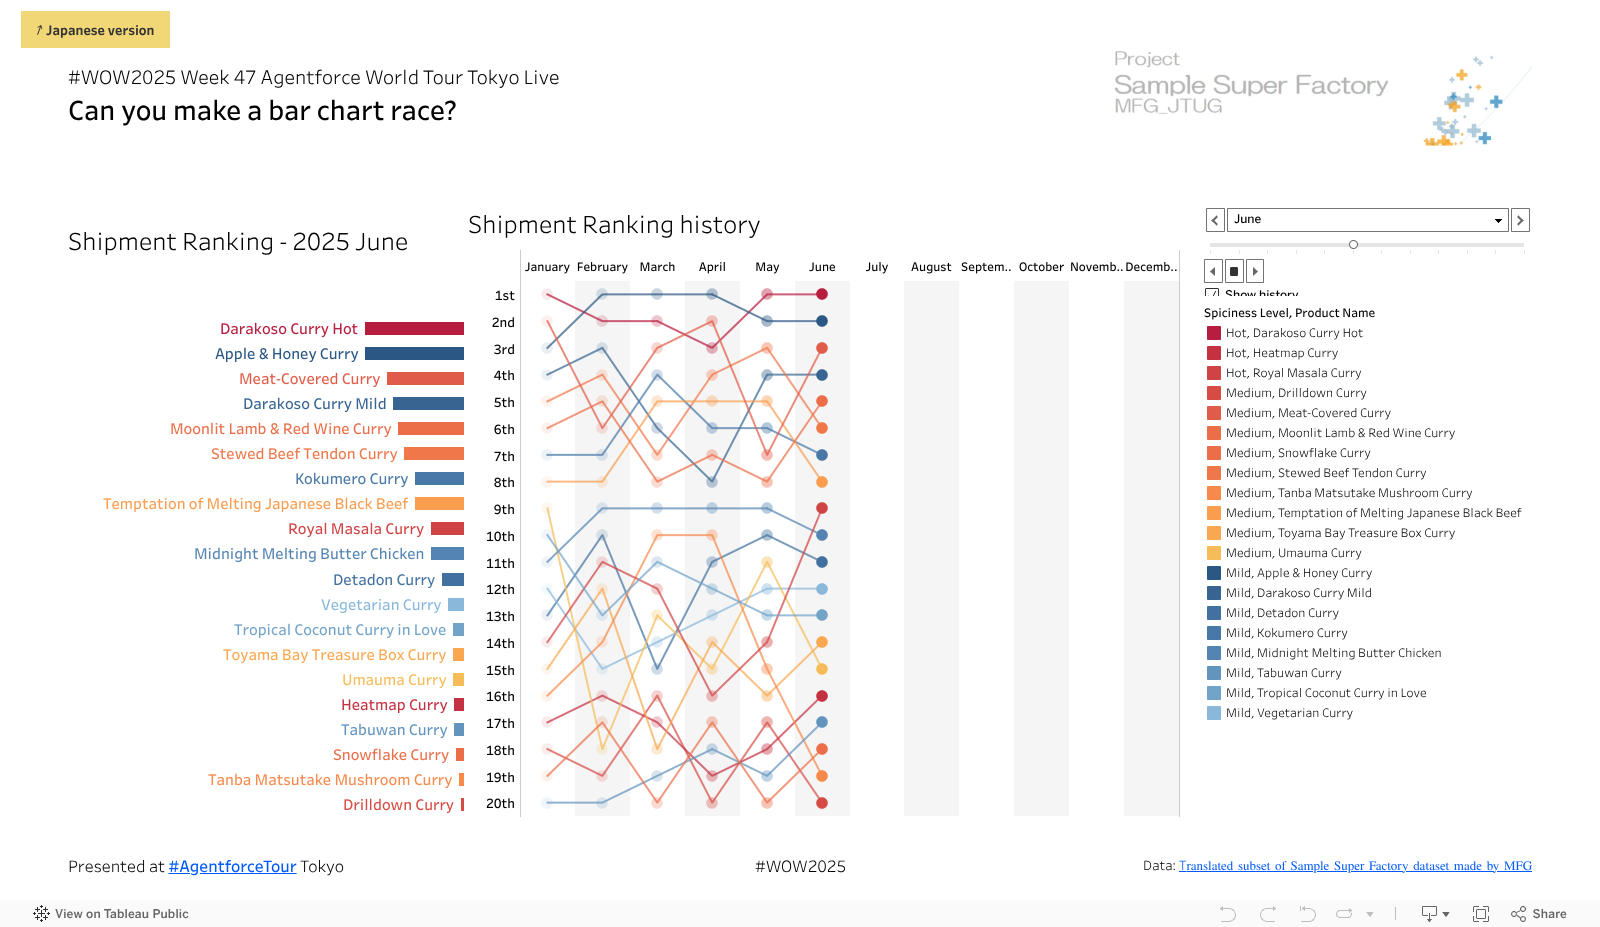
A Bump Chart displaying the monthly rank history (based on total shipments) up to the selected month.
A Bar Chart Race showing how product rankings change over time based on total shipments for the selected month.
Display product name at the left end of each bar
Products dynamically change position based on their ranking
Display product name at the left end of each bar
Color-code by spice level and product name
Match tooltips as closely as possible
The filename of the image displayed in the tooltip is linked to the [Product ID] column.
Dataset
This challenge uses a translated subset of Sample Super Factory dataset made by MFG JTUG (@mfg_tug_jp). You can download the data here (Google Drive).
Attribute
When you publish your solution on Tableau Public make sure to take the time and include a link to the original inspiration. Also include the hashtag #WOW2025 in your description to make it searchable!