Ann Jackson

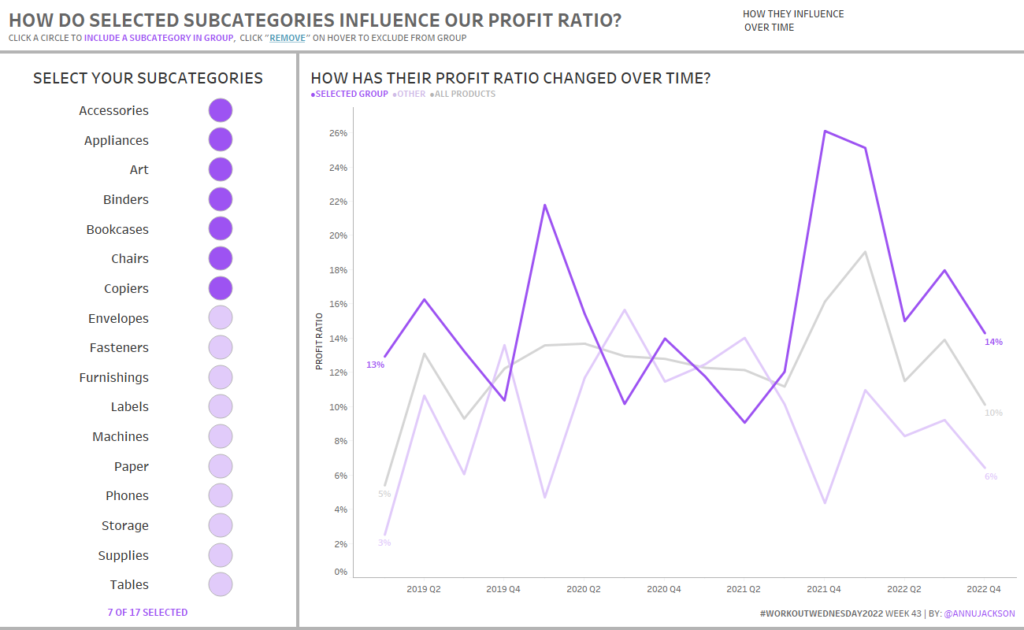
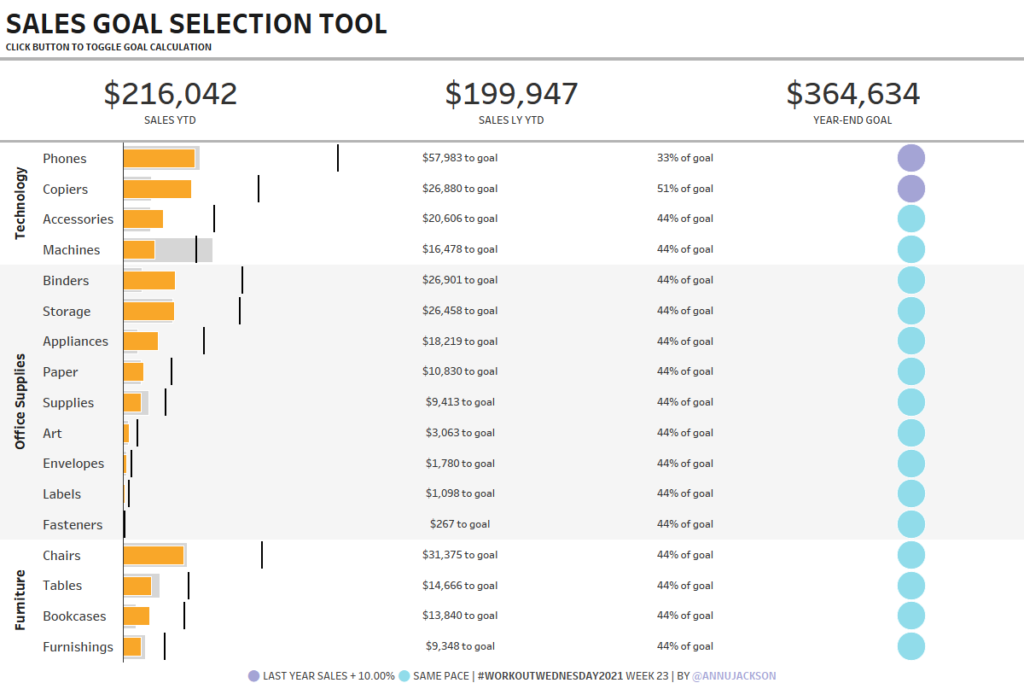
#WOW2022 | Week 43 | Selected Subcategory Influence

Watch Introduction Hi Workout Wednesday friends!  I’m back, just in time for the Tableau 2022.3 release, which means we’ll be exploring Dynamic Zone Visibility.  This new feature allows you to use calculations and logic to dynamically show and hide dashboard elements (pretty powerful).  So in this challenge, you’ll get some hands on exposure to this …

#WOW2022 | Week 43 | Selected Subcategory Influence Read More

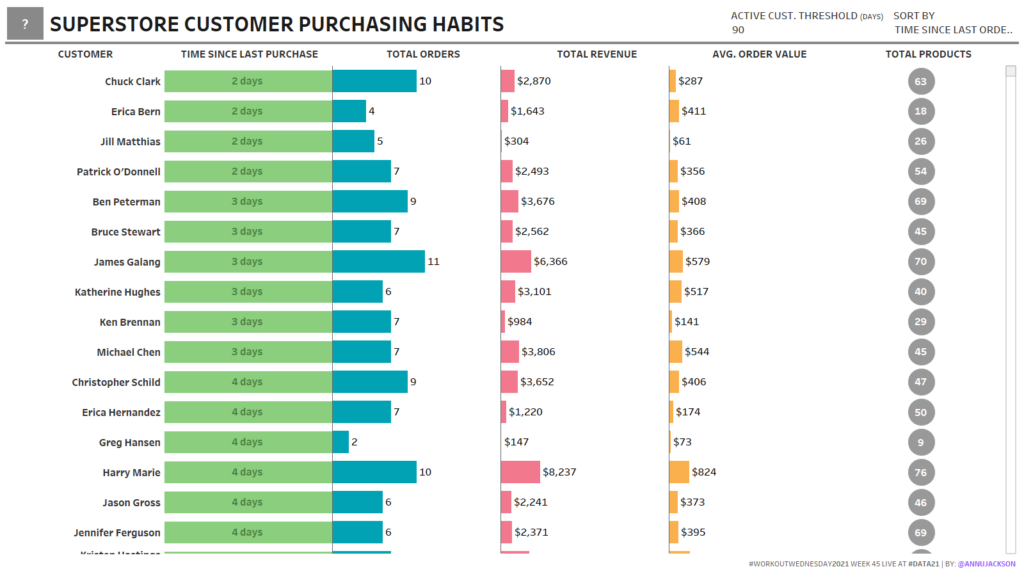
2021 Week 45 | Tableau: Customer Purchasing Habits (RFM Analysis)

Introduction Well we made it another year!  I hope if you’re reading this that you’re knee deep in content from Tableau’s annual conference, #data21.  There’s lot to enjoy throughout the week, and I look forward to seeing you all in the various communication channels and platforms that are available! For this week’s challenge, I decided …

2021 Week 45 | Tableau: Customer Purchasing Habits (RFM Analysis) Read More

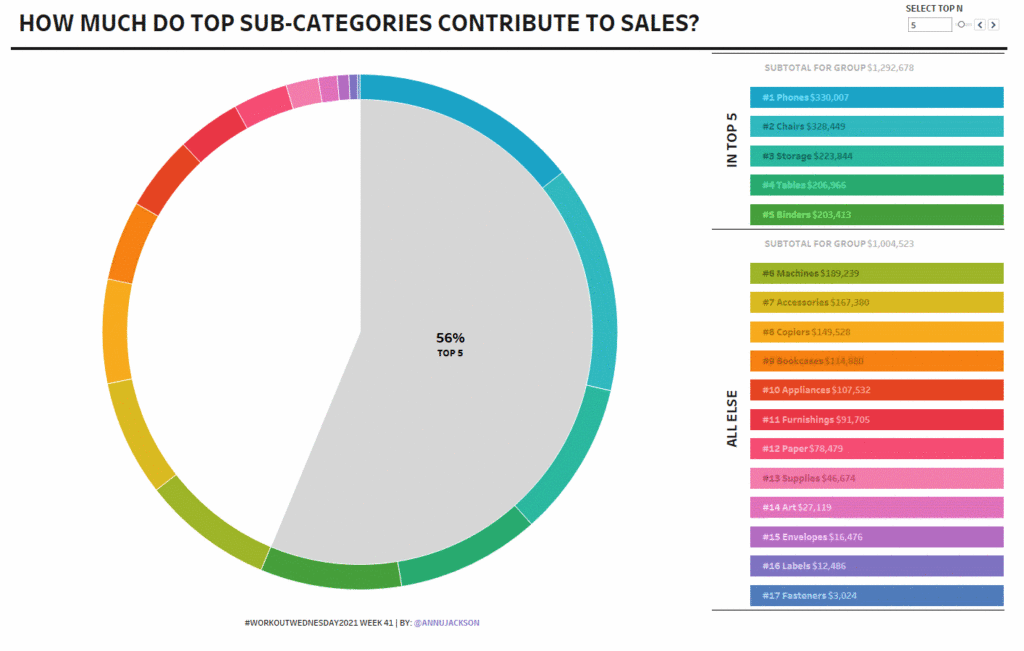
2021 Week 41 | Tableau: How Much Do Top Sub-Categories Contribute to Sales?

Introduction I hope everyone enjoyed Community Month!  I’m excited to be back and to share a fun challenge that highlights using pie charts (puns a plenty today!). This challenge is based on a request from a sales team – they wanted to understand how individual accounts contributed to their overall revenue.  The beauty of this …

2021 Week 41 | Tableau: How Much Do Top Sub-Categories Contribute to Sales? Read More

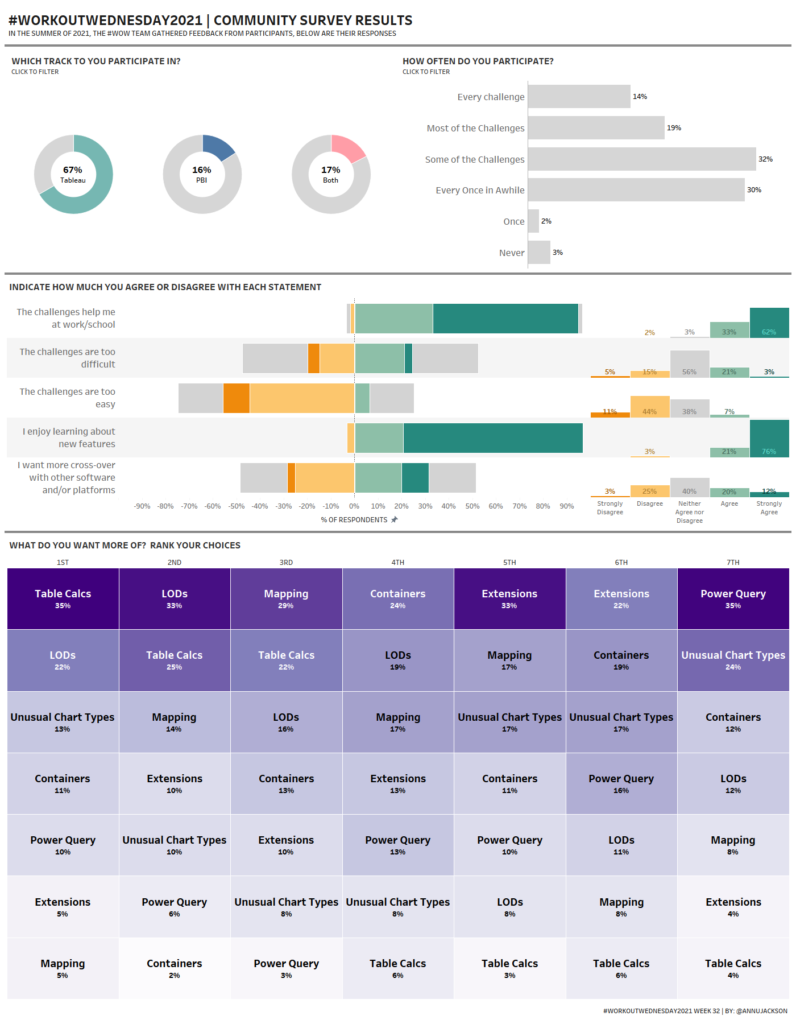
2021 Week 32 | Tableau: Visualize our Survey Data

Introduction We recently wrapped up a Survey for the Workout Wednesday community gauged at understanding what YOU are interested and what areas of opportunity our team may have. During our latest group meeting I was struck with the idea that this was the perfect opportunity to get a twofer – practice visualizing survey data AND …

2021 Week 32 | Tableau: Visualize our Survey Data Read More

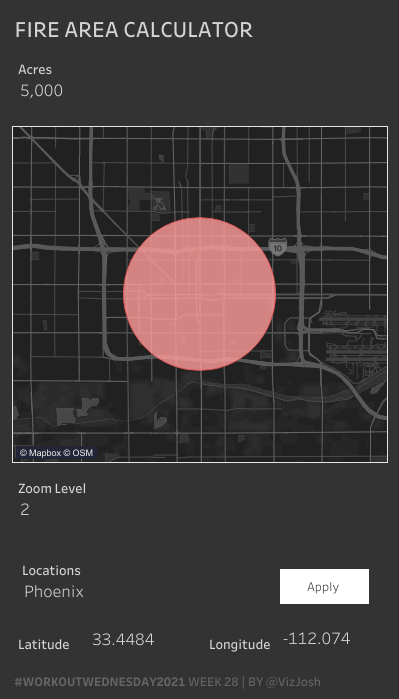
2021 Week 28 | Tableau: Can you build an app to visualize wildfires?

Introduction This week’s Workout Wednesday is brought to you by Josh Jackson.  For those who don’t know, Josh is my husband!  He typically prefers to stay in the background, but asked if he could borrow one of my weeks to share this challenge.  Here’s the challenge in his own words: This week is inspired by …

2021 Week 28 | Tableau: Can you build an app to visualize wildfires? Read More

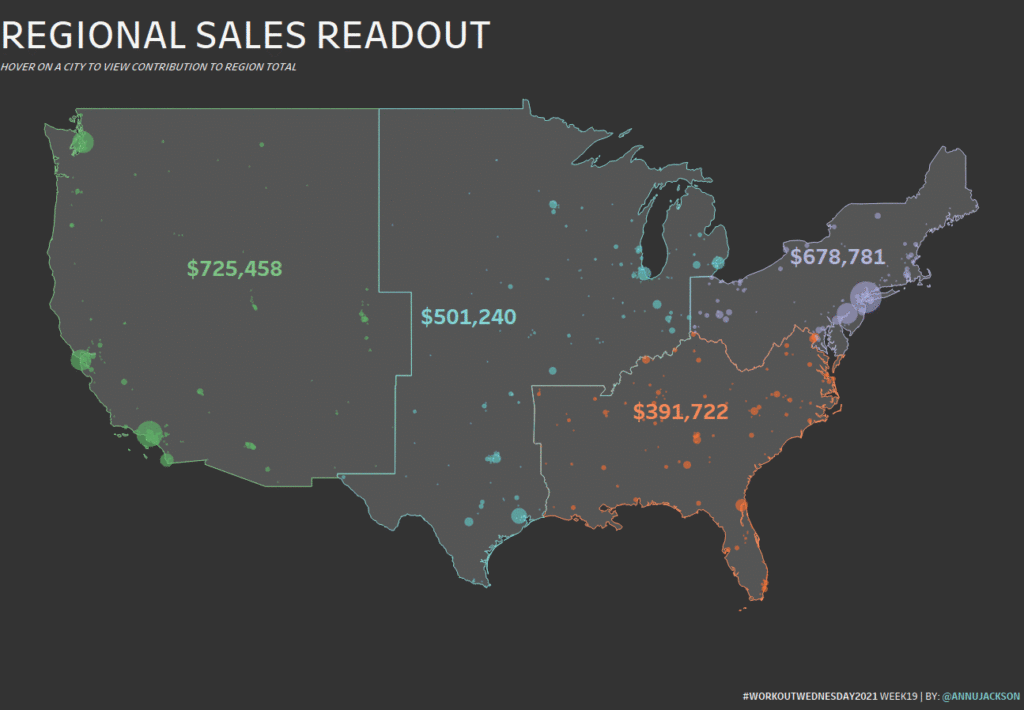
2021 Week 19 | Tableau: Regional Sales Readout

Introduction Recently I’ve been spending more time working with Map Layers, so this week is dedicated to reimagining maps using this feature. You’re tasked with recreating a Regional Readout Report where Sales teams can see the performance of various cities within their Region.  They’ll be able to get more information by hovering over a city. …

2021 Week 19 | Tableau: Regional Sales Readout Read More

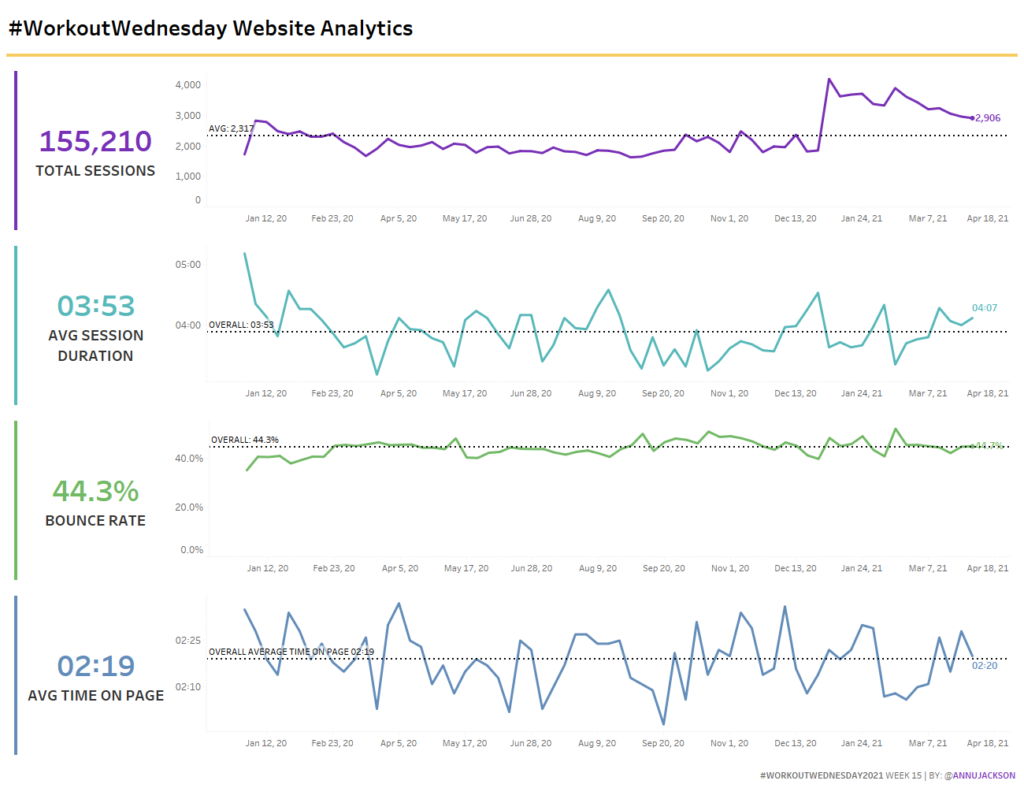
2021 Week 15 | Tableau: Website Analytics

Introduction Lately I’ve been working with Google Analytics data, so I thought I’d pass on a data set to you!  Our data set was created by you the audience – it’s extracted directly from our website analytics. This week’s challenge focuses on a lot of little things coming together – dashboard design, formatting, and reference …

2021 Week 15 | Tableau: Website Analytics Read More

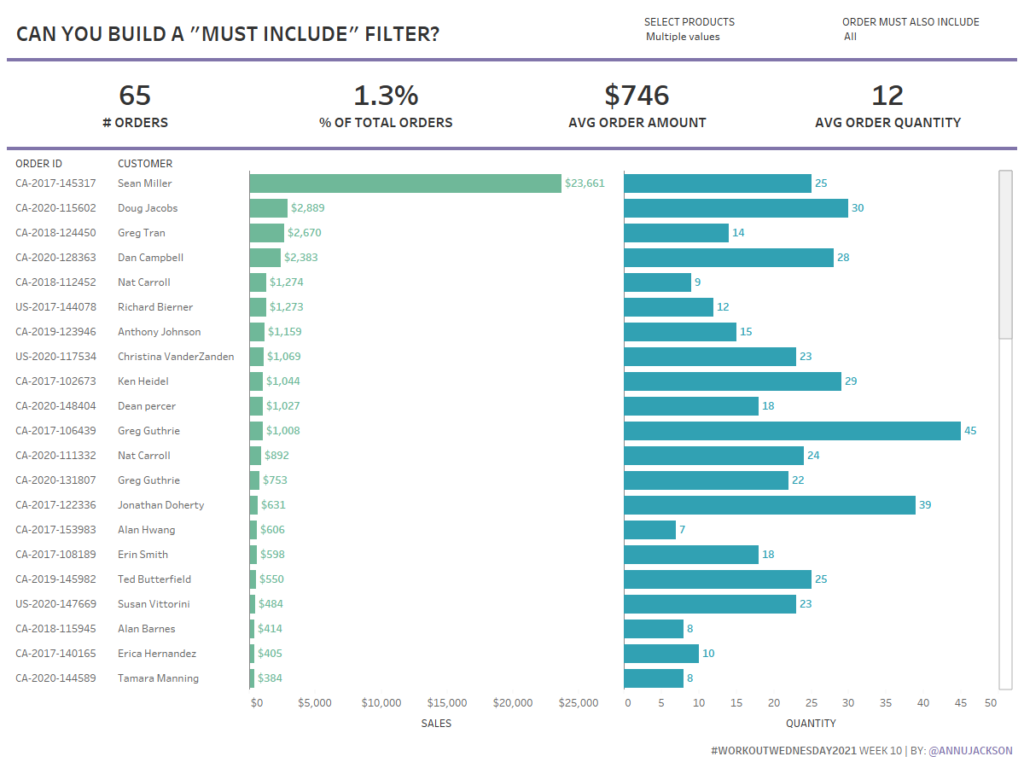
2021 Week 10 | Tableau: Can you build a must include filter?

Introduction This week’s challenge is pulled directly from a work challenge I encountered recently.  The ask was to build a filtering system that would allow the user to initially filter data and then add a secondary requirement of inclusion. Using the Superstore data set, the functionality we wanted to achieve was: Allow user to filter …

2021 Week 10 | Tableau: Can you build a must include filter? Read More

Scroll to Top