2024 Week 27 | Power BI: Scatter plot showing the path of selected data points
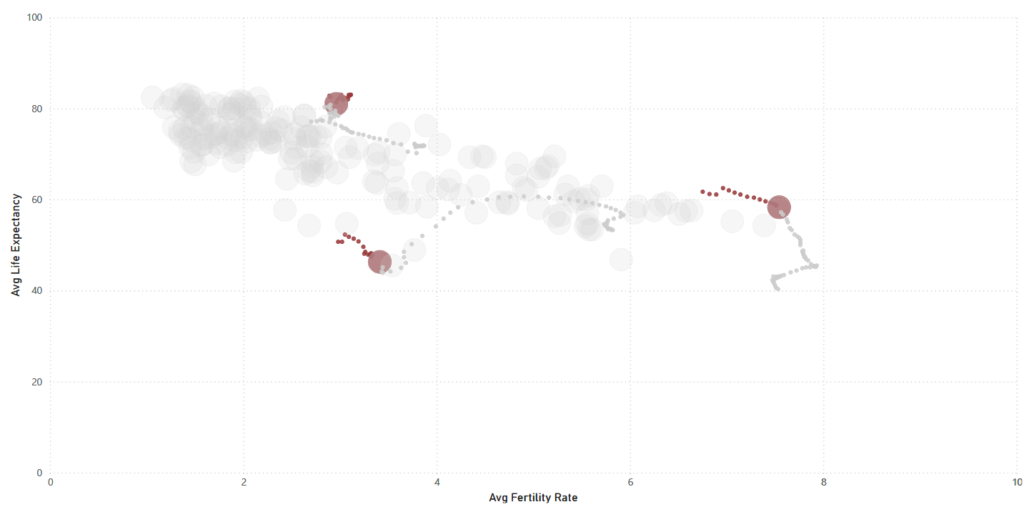
Introduction The challenge for this week is to first build a scatter plot of fertility vs life expectancy of different countries. However, this will not just be for a single year, but will contain information across many years, making it possible to slide the year and see how all the bubbles move. The key challenge […]
2024 Week 27 | Power BI: Scatter plot showing the path of selected data points Read More »