Diana Ackermann

Diana is a freelance statistician and a data nerd with 15+ years of turning data chaos into strategic decisions for leadership teams. Her passion is transforming complex data into clear executive insights through Power BI reports that leaders actually use.

2025 Week 45 | Power BI: Create dynamic annotations

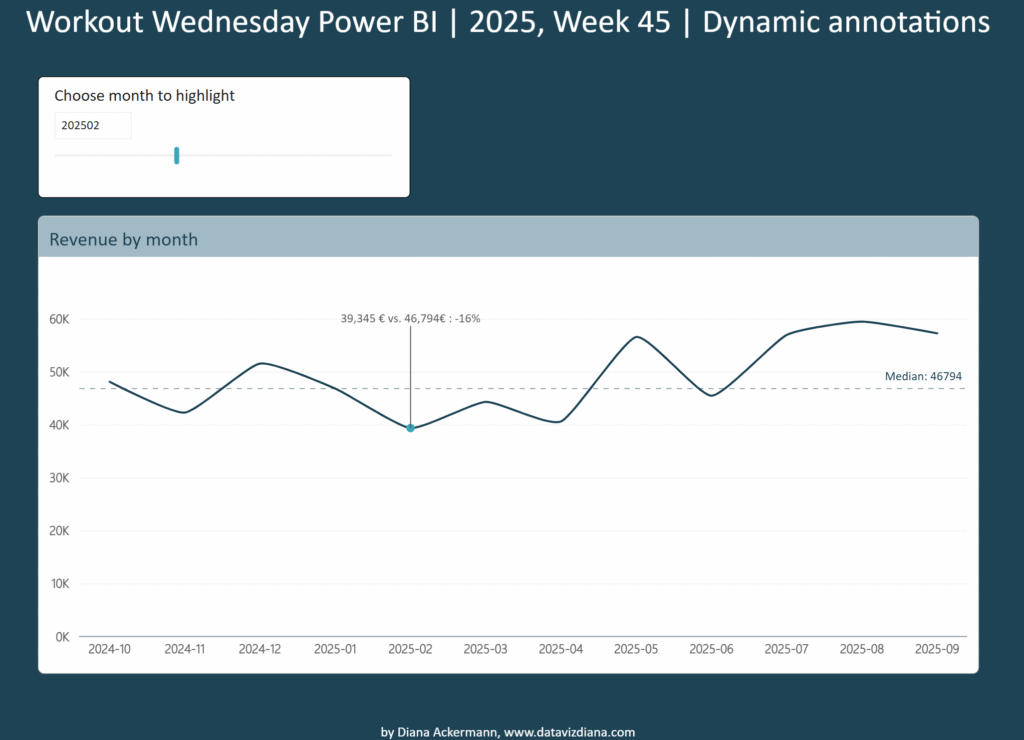
Introduction Welcome back to Workout Wednesday! This week we’re creating a dynamic annotation slicer that highlights specific data points on a time series chart. Imagine you’re presenting monthly revenue trends to stakeholders who want to quickly assess performance against the typical baseline. Instead of manually pointing out values, you create an interactive chart where users …

2025 Week 45 | Power BI: Create dynamic annotations Read More »
2025 Week 10 | Power BI: Line Chart with dynamic formatting

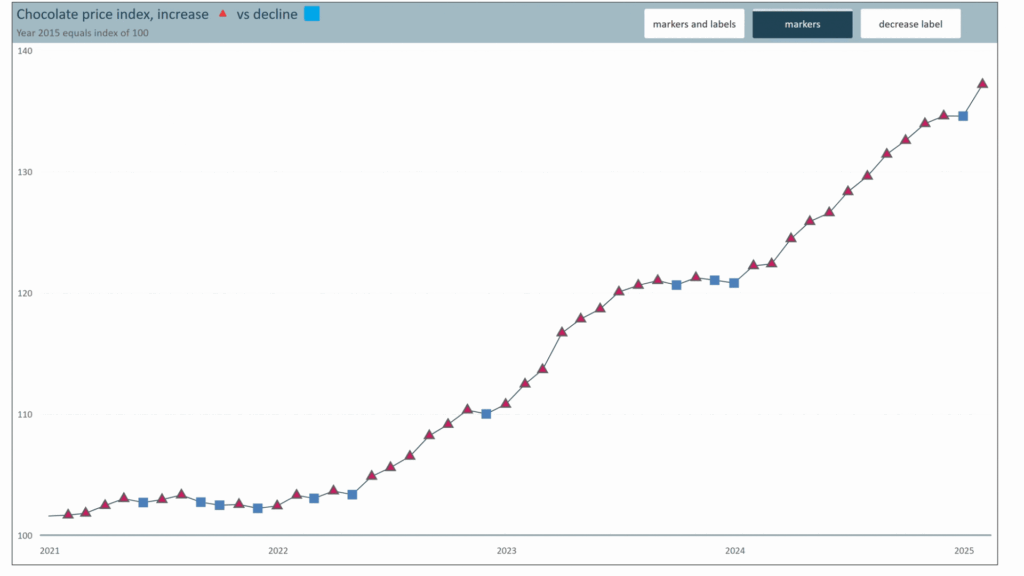
Introduction Hi to everybody! I am so happy to be among the new contributors for Workout Wednesday. I believe these kinds of challenges bring tremendous value to everyone who tries something new on a regular basis—you’ll learn so much! We will look at the consumer price index for chocolate in the Euro region. As you …

2025 Week 10 | Power BI: Line Chart with dynamic formatting Read More »