2024 Week 34 | Power BI: Visual Calcs and Parameters
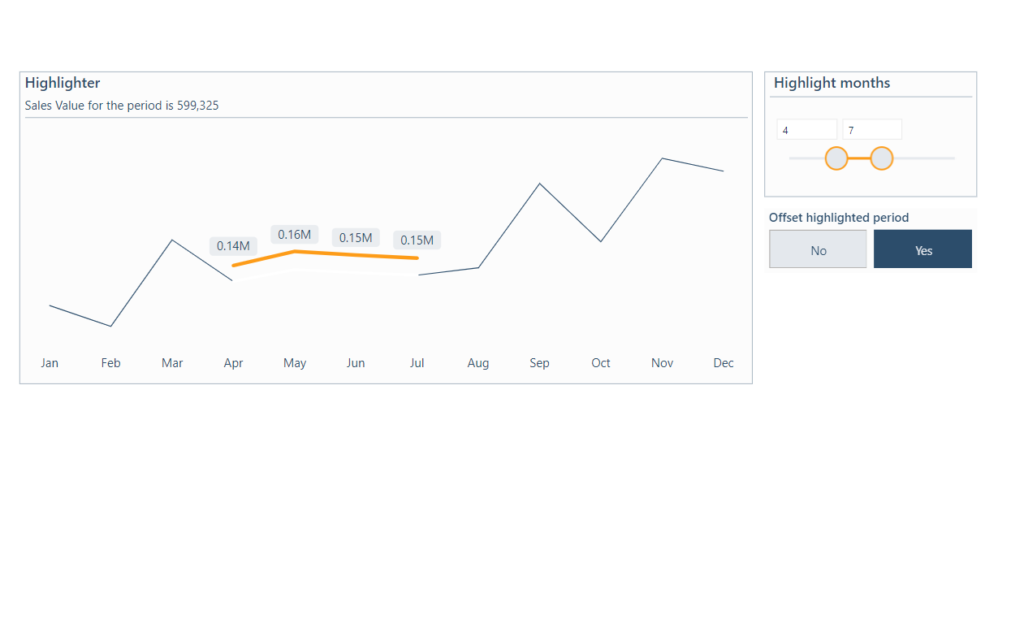
Introduction This week’s challenge is provided by guest contributor Erik Svensen https://www.linkedin.com/company/catmansolution. The workout will use visual calculations in combination with numeric parameters to highlight a period in a development chart. (Please note visual calculations do not currently publish to web) Requirements 1. Retrieve the data from Google Sheets – (you only need orders)2. Add […]
2024 Week 34 | Power BI: Visual Calcs and Parameters Read More »