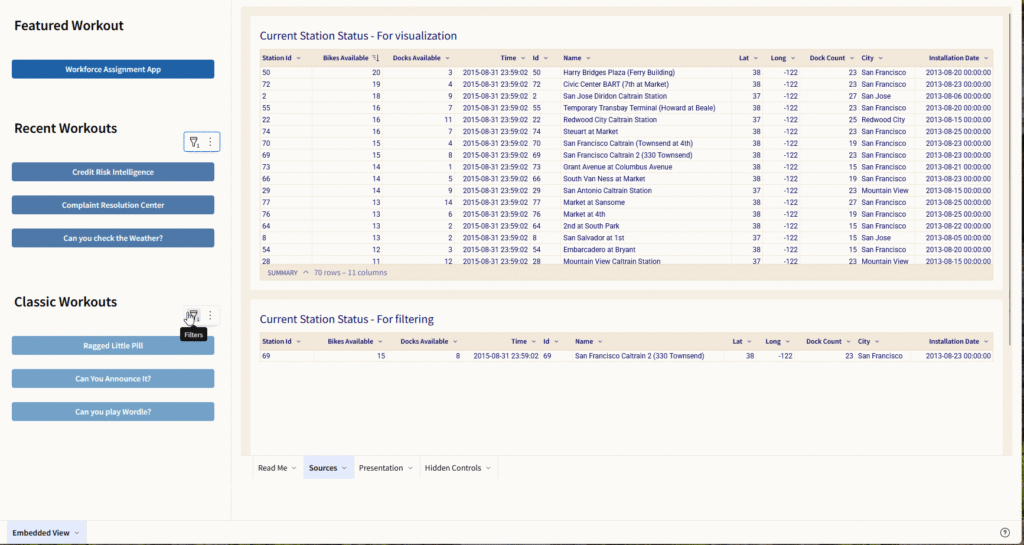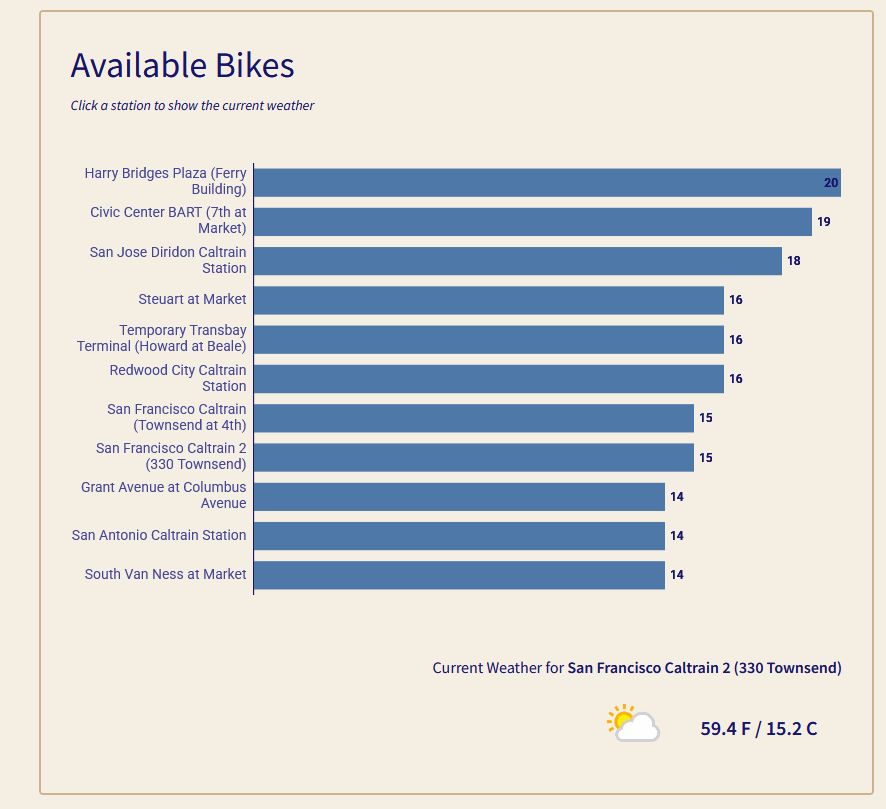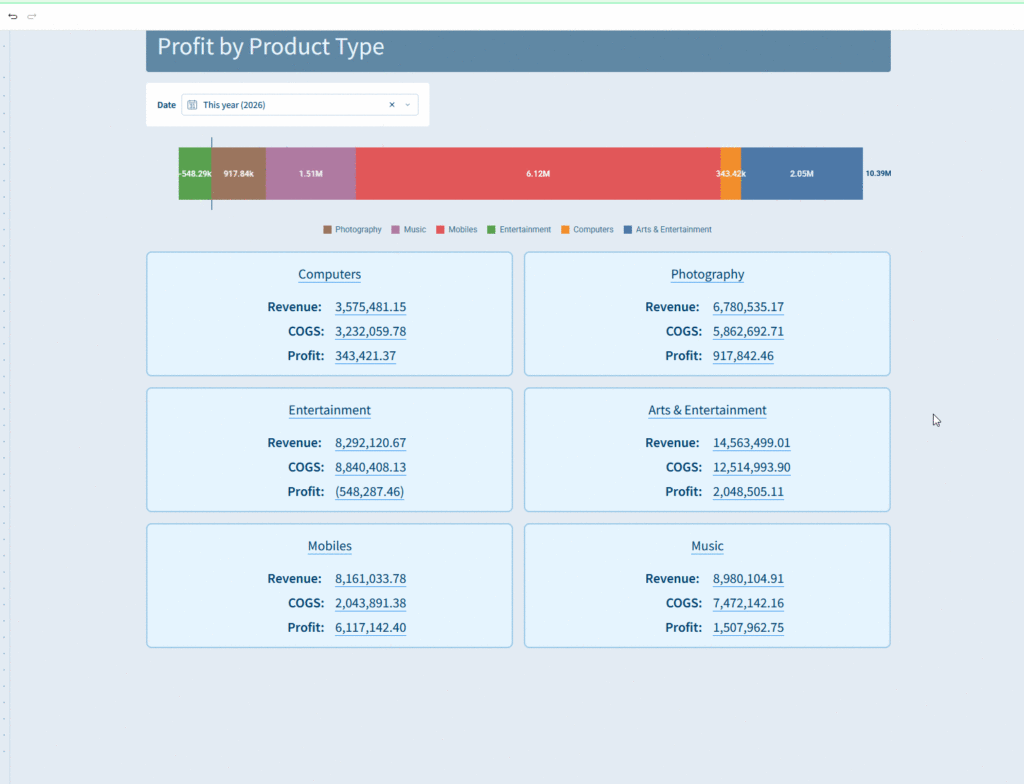
2026 Week 25 | Can you standardize your inputs?
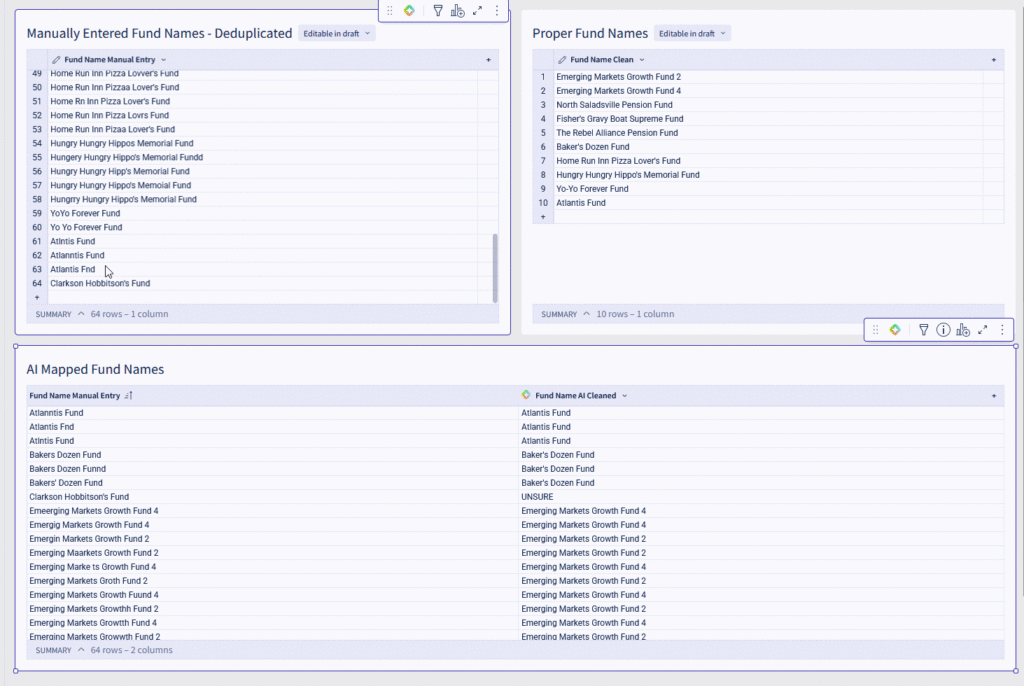
Introduction Some of the most important tasks in a BI implementation are not pretty or fun. One of the tasks that comes up any time I’m pulling in data from sources is how to standardize fields across multiple systems. This is especially tricky when the fields may have been manually input at some point in […]
2026 Week 25 | Can you standardize your inputs? Read More »
Sigma, Workout Wednesday