Gerard Duggan

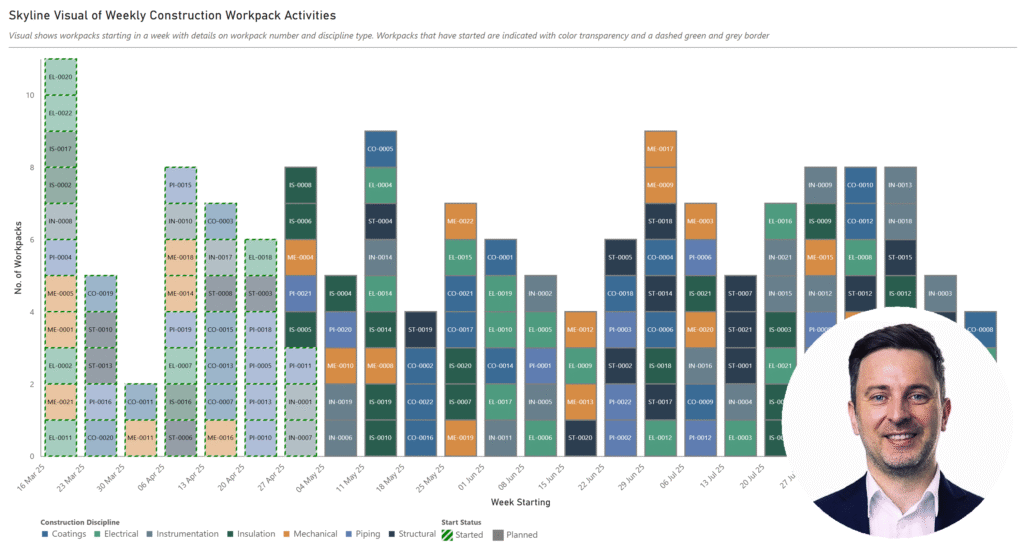
Screenshot of a skyline chart created using Deneb in Power BI

2025 Week 18 | Power BI: Create a skyline chart

Introduction Hello everyone! This week we are looking at developing a ‘Skyline’ visual.   Anyone outside of the construction industry may not have heard this term before, but it is kind of a combination of a stacked column visual and a kanban board.   It is used in construction to show construction activities (workpacks) that …
2025 Week 18 | Power BI: Create a skyline chart Read More

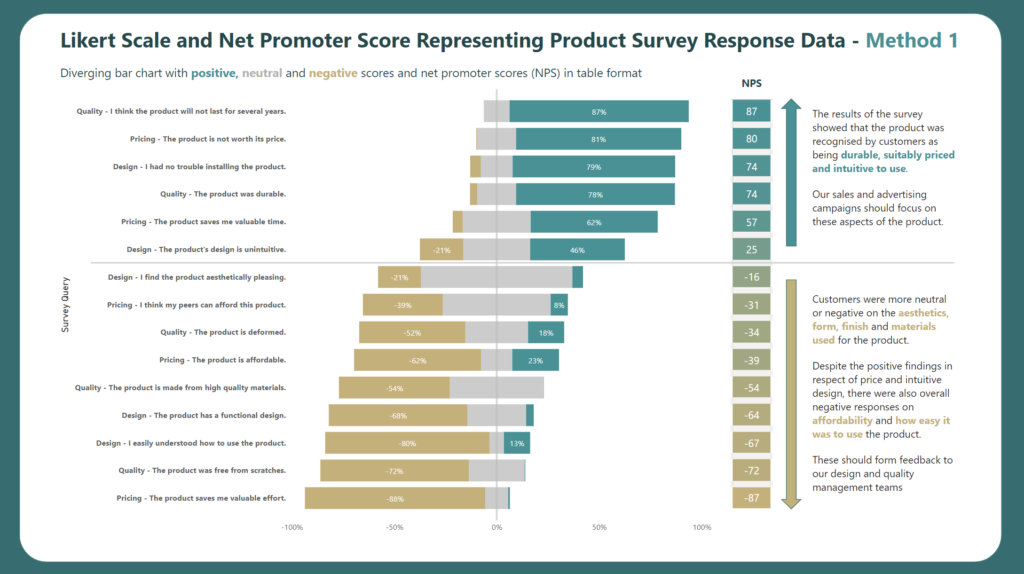
2022 Week 41 | Power BI: Likert Scale and Net Promoter Score (NPS)

Introduction This month we are getting the #WorkoutWednesday community involved in the challenges with Community Month. Each week we’re going to have an outstanding member of our community present a challenge. This week we have Gerard Duggan from sunny down under (Australia). Gerard rocks the Power BI community showing us how to present outstanding analysis …

2022 Week 41 | Power BI: Likert Scale and Net Promoter Score (NPS) Read More

Scroll to Top