Kathrin Borchert

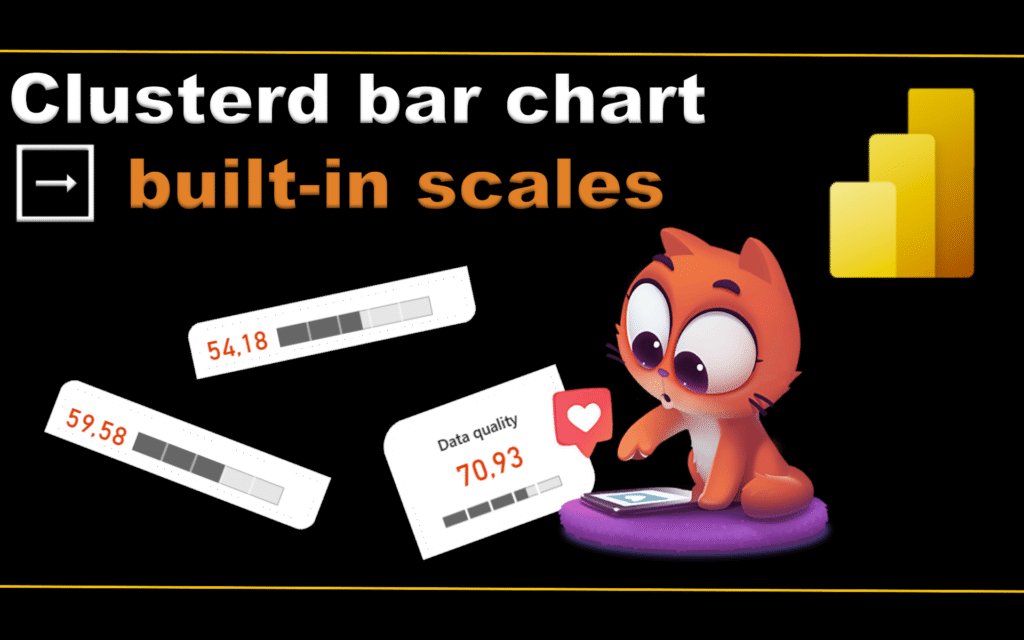
2025 Week 30 | Power BI: Bar chart with built-in scales 📏

Introduction Happy Workout Wednesday, data fam! This week, we’re taking bar charts to the next level—with built-in scales that visually speak for themselves! We all love a good bar chart, but sometimes you want to show progress toward a goal or segment values into performance zones – without extra visuals, DAX trickery, or custom backgrounds. Just …

2025 Week 30 | Power BI: Bar chart with built-in scales 📏 Read More

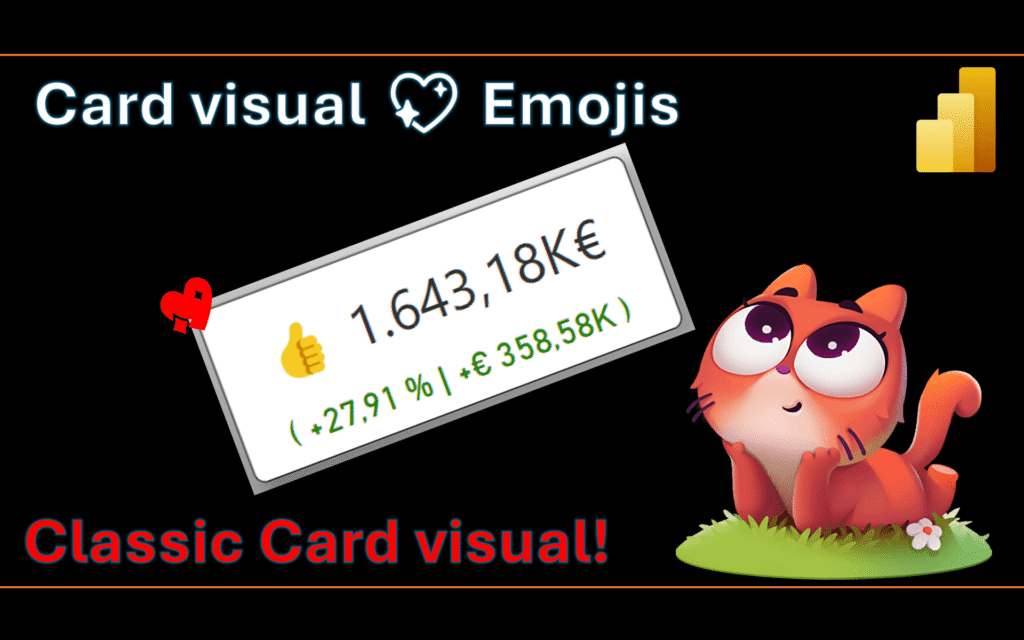
2025 Week 16 | Power BI: Cards – NEXT Level | with emojis and variances label

Introduction 🎉 Happy Workout Wednesday, data fam! 🎉 I’m thrilled to be back with another Power BI challenge—and this one is all about taking something simple and pushing it to the NEXT level! 💪 Cards are often the go-to for showing big, bold numbers. But what if we could make them smarter? More informative, expressive, …

2025 Week 16 | Power BI: Cards – NEXT Level | with emojis and variances label Read More

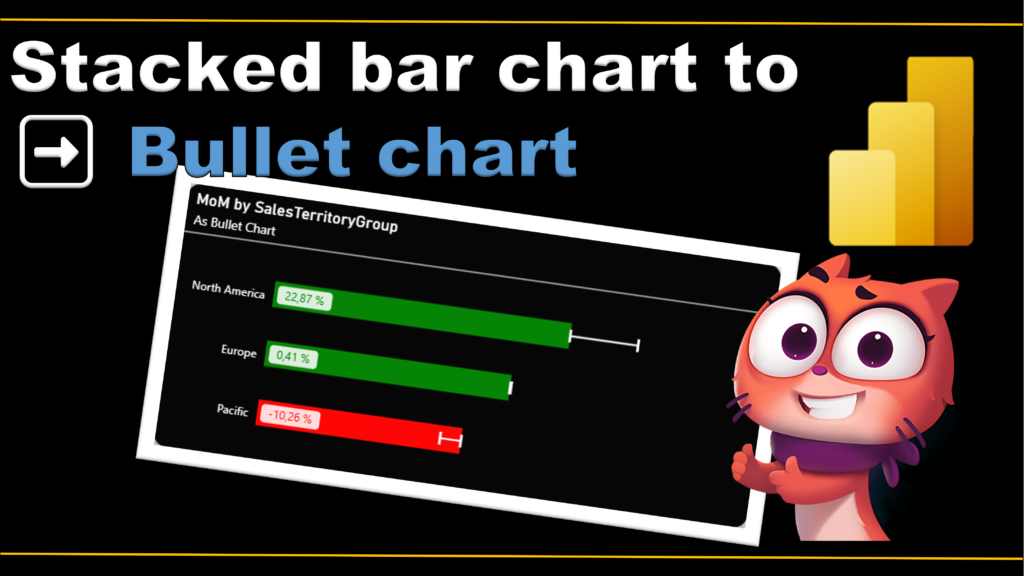
2025 Week 9 | Power BI: From stacked bar chart to bullet chart

Introduction I’m incredibly honored to be part of this amazing group of Power BI enthusiasts, and I couldn’t be more excited to share my very first Workout Wednesday challenge with you all! Have you ever looked at a visualization and thought, there has to be a better way to present this data? This week, we’re …

2025 Week 9 | Power BI: From stacked bar chart to bullet chart Read More

Scroll to Top