2025 Week 21 | Sigma : Can you Combo Like that?
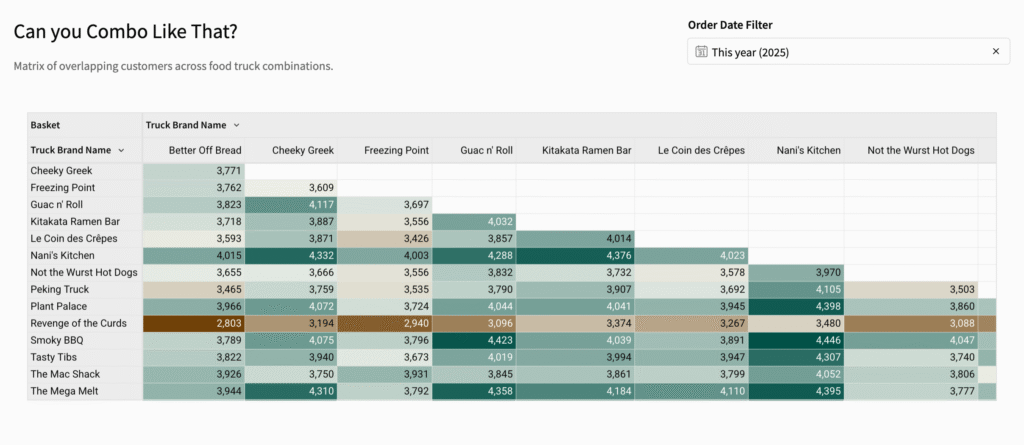
Introduction This week, we’re building a market basket or matrix analysis to help us understand the frequency of combinations. For this week’s challenge, we’re looking at which Food Trucks have the most customers in common. Have Fun! Katrina Need access to Sigma? Click Here to Sign Up Link to WOW Sigma Instance Youtube Click here […]
2025 Week 21 | Sigma : Can you Combo Like that? Read More »
Sigma, Workout Wednesday