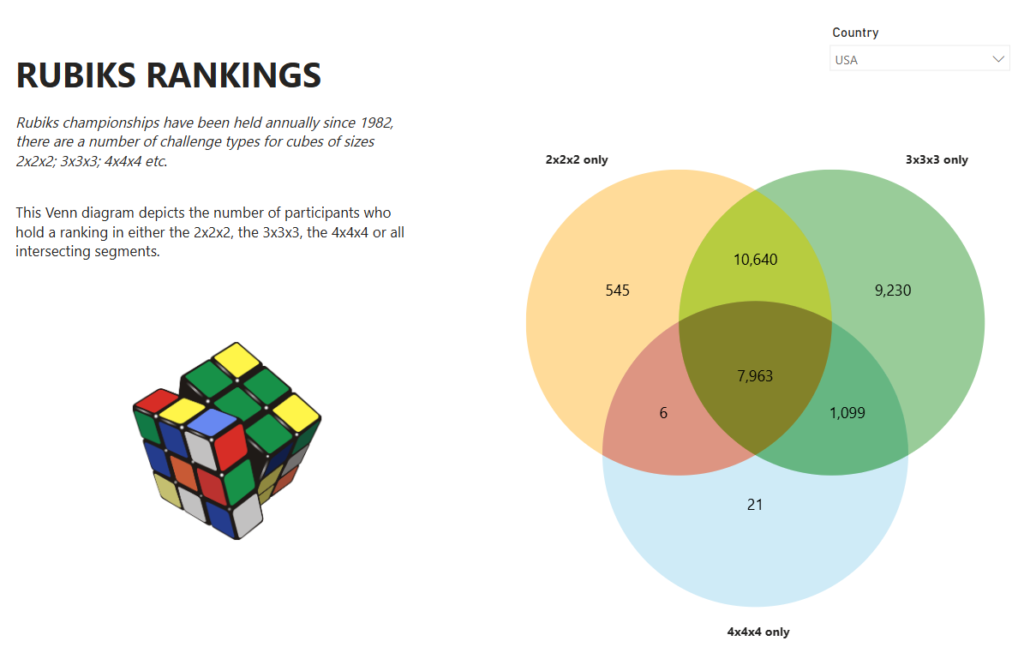
2024 Week 23 | Power BI: SVG Venn Diagram
Introduction Power BI does not offer a Venn Diagram option as a core visual. This is not surprising given there are not many uses for this kind of visualisation. However, most people can read and understand the meaning of a Venn Diagram when they see one. Venn Diagrams is they are useful to display overlaps […]
2024 Week 23 | Power BI: SVG Venn Diagram Read More »
