Phillip Schrijnemaekers

2024 Week 32 | CRM Analytics: Dataset Filtering

Introduction Hi again, guys. In this challenge, we will learn a new way to filter our dataset. I know, it’s pretty basic, but check the rules session to make it more interesting and have fun đŸ˜‰ Requirements Create a dev org or use an existing org you have access to. Connect 2 related objects to …

2024 Week 32 | CRM Analytics: Dataset Filtering Read More

CRM Analytics: Quasi-Histogram – SOLUTION

Introduction Last week the challenge was how to create a quasi-histogram in CRM Analytics. Here is my solution, hope you guys like it. If you used a different solution, share it with us in the comments. Solution Let’s start by getting any numeric value from our dataset. You can upload your dataset. I am using …

CRM Analytics: Quasi-Histogram – SOLUTION Read More

2024 Week 27 | CRM Analytics: Quasi-Histogram

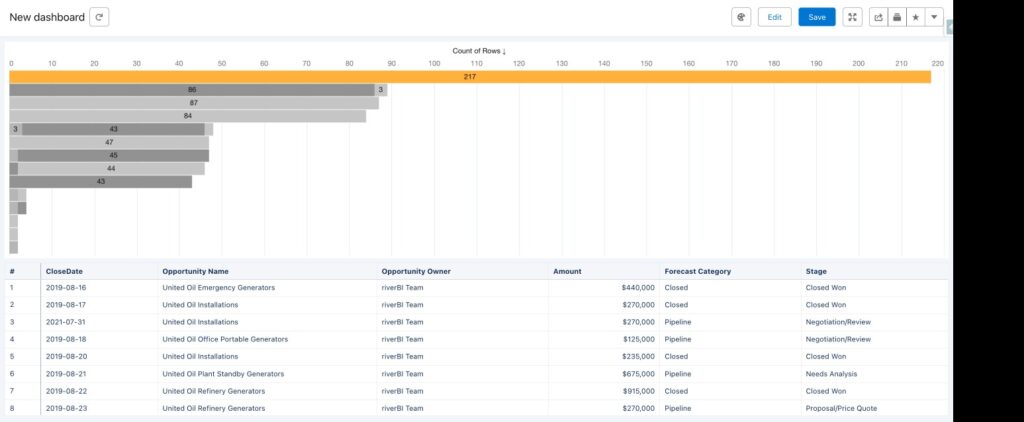
Introduction Hello again, everyone. One of the things that CRM Analytics misses in its variety of charts is a histogram. A histogram is a chart that displays the frequency (count) of rows within a range of numeric values. For example: you have opportunity records with several amounts (2500,3000,5000.8750.10000, etc). In a histogram, we’d create a …

2024 Week 27 | CRM Analytics: Quasi-Histogram Read More

2024 Week 22 – Top 4 industries + “Other”

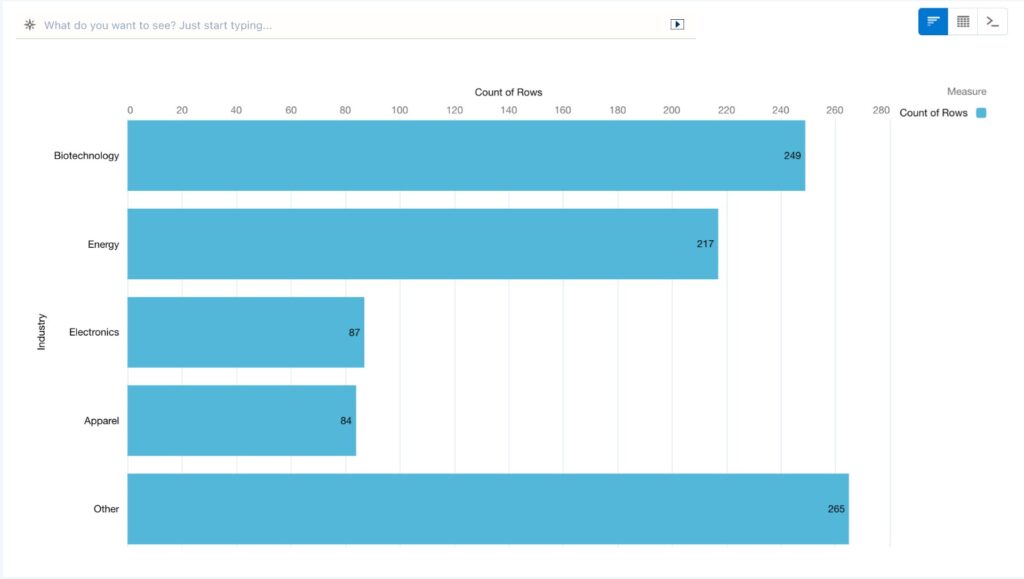
Introduction Hello again, everyone. As data analysts, we are frequently asked to present the “Top N” group members sorted by a metric. In this blog, we’ll try to bring the top 4 accounts industries sorted by count, and group all the following members in a single “Other” bar below the top 4 ones. Requirements Create …

2024 Week 22 – Top 4 industries + “Other” Read More

2024 Week 17 – Dynamic dashboard Tables

Introduction Hey guys! Welcome back to a new challenge!! One of the things I like the most about CRMA is how easy is to customize and make the dashboard dynamic and flexible, to display the data we want. In this challenge , let’s build a chart using 3 different datasets, and use the interactions of …

2024 Week 17 – Dynamic dashboard Tables Read More

2024 Week 12 | CRM Analytics: Brazil’s opportunities dashboard 

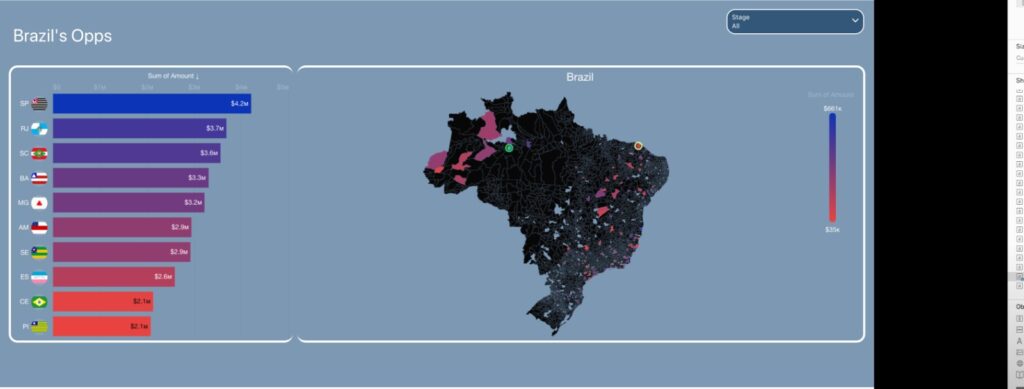
Introduction Maps, maps, and maps. We all love them, after all, in an era where data drives decision-making across industries, the significance of map charts cannot be overstated. From tracking global trends to uncovering localized patterns, these visualizations serve as powerful navigational aids in our quest for understanding. Following our trend of past challenges, this …

2024 Week 12 | CRM Analytics: Brazil’s opportunities dashboard  Read More

2024 Week 07 – Column interaction sorting

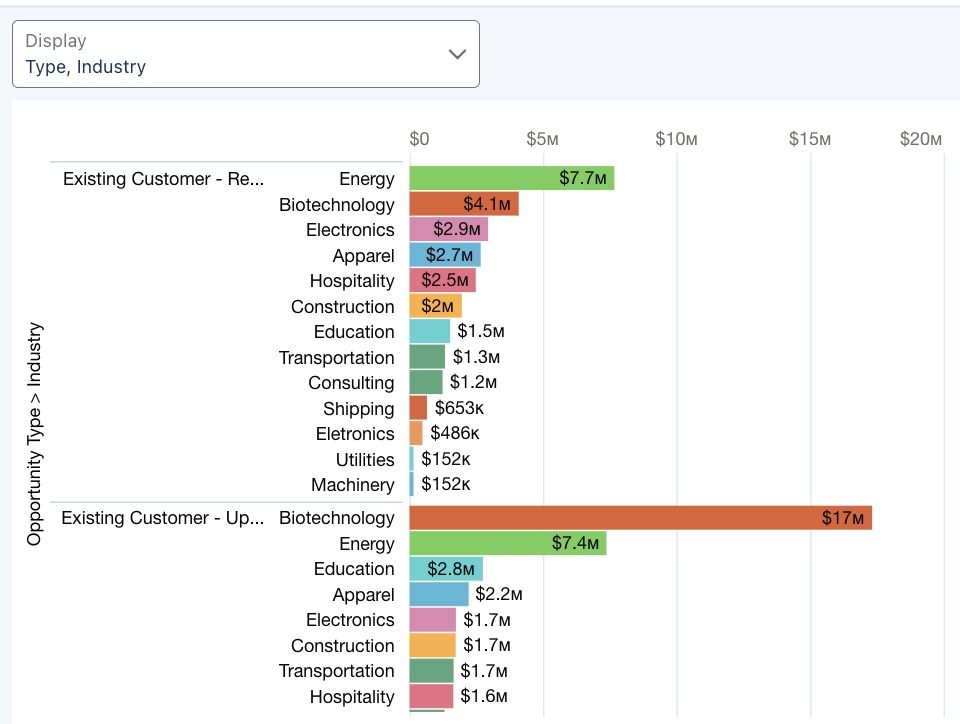
Introduction It’s already week 7 of our #WorkoutWednesday challenges (whoa, time flies…). In this challenge, I’d like to explore one aspect of the column multi-selection interaction in CRM Analytics: sorting. When we select more than 1 grouping, can we maintain the sorting within the selected groups, regardless of the selection’s order? We’ll find out in …

2024 Week 07 – Column interaction sorting Read More

2024 Week 03 – Double bar amount by accounts

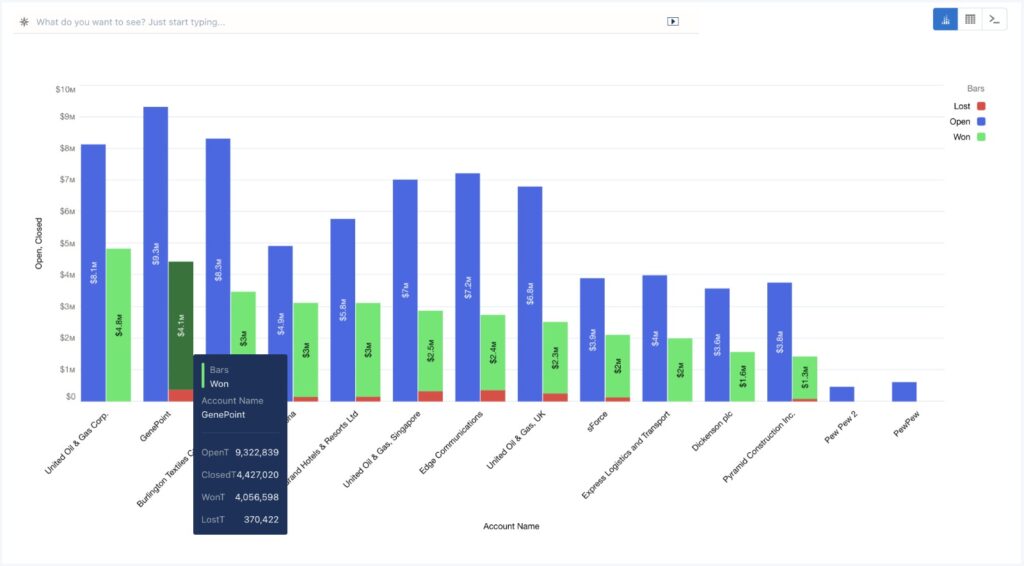
Introduction 2024 is here! And with that, a completely new set of challenges for you, data lover.  Let’s sharpen our CRMA skills with this challenge: A double bar chart displaying open and closed amounts by account. The closed amount should display won and lost amounts in a single stacked bar. The open amount should be …

2024 Week 03 – Double bar amount by accounts Read More

Scroll to Top