Spencer Baucke

2021 Week 47 | Power BI: Custom Line Chart Formatting

Introduction This week we are continuing our design theme by working through a custom formatting hack for line charts. Conditional formatting in Power BI can be tricky at times, especially when trying to format different chart types.  If you are familiar with conditionally formatting a line chart, you’ll know that in the Data Colors section …

2021 Week 47 | Power BI: Custom Line Chart Formatting Read More

2021 Week 32 | Power BI: Toggling Views with Bookmarks

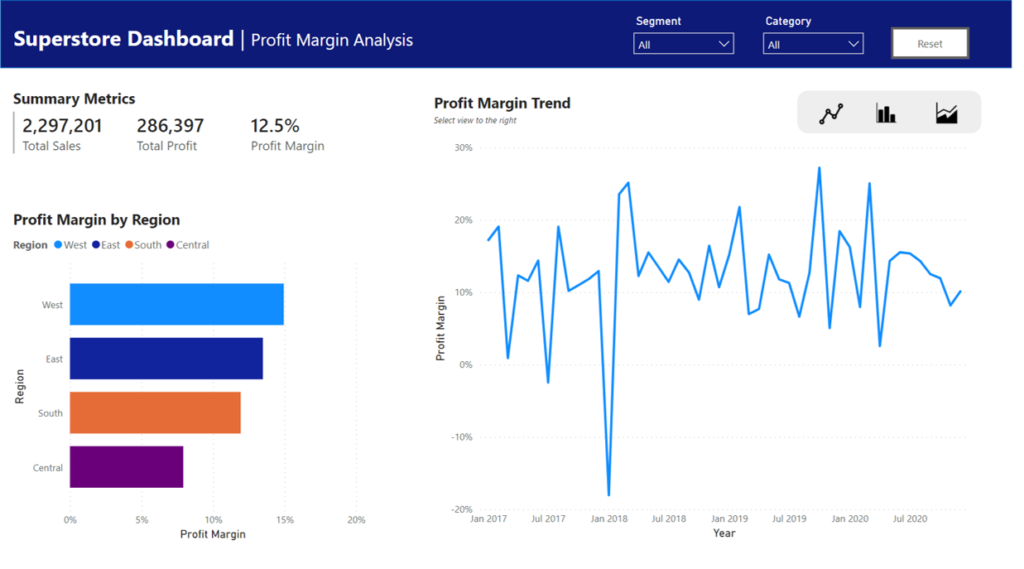
Introduction This week we are going to be exploring how to use Bookmarks to toggle between different views in a report. There are a number of things you can do with Bookmarks, but in this week’s example we are going to use them to toggle between chart views and then as a Reset Filters button. …

2021 Week 32 | Power BI: Toggling Views with Bookmarks Read More

2021 Week 28 | Power BI: Web Scraping with Power Query

Introduction July is “Power Query Month”, where the theme is focused less on visualization and more on data preparation. Every Power BI challenge requires Power Query to get and transform data, but now we’re going deeper in July! If you haven’t checked out Dave’s challenge from last week, make sure to check it out here.   This …

2021 Week 28 | Power BI: Web Scraping with Power Query Read More

Scroll to Top