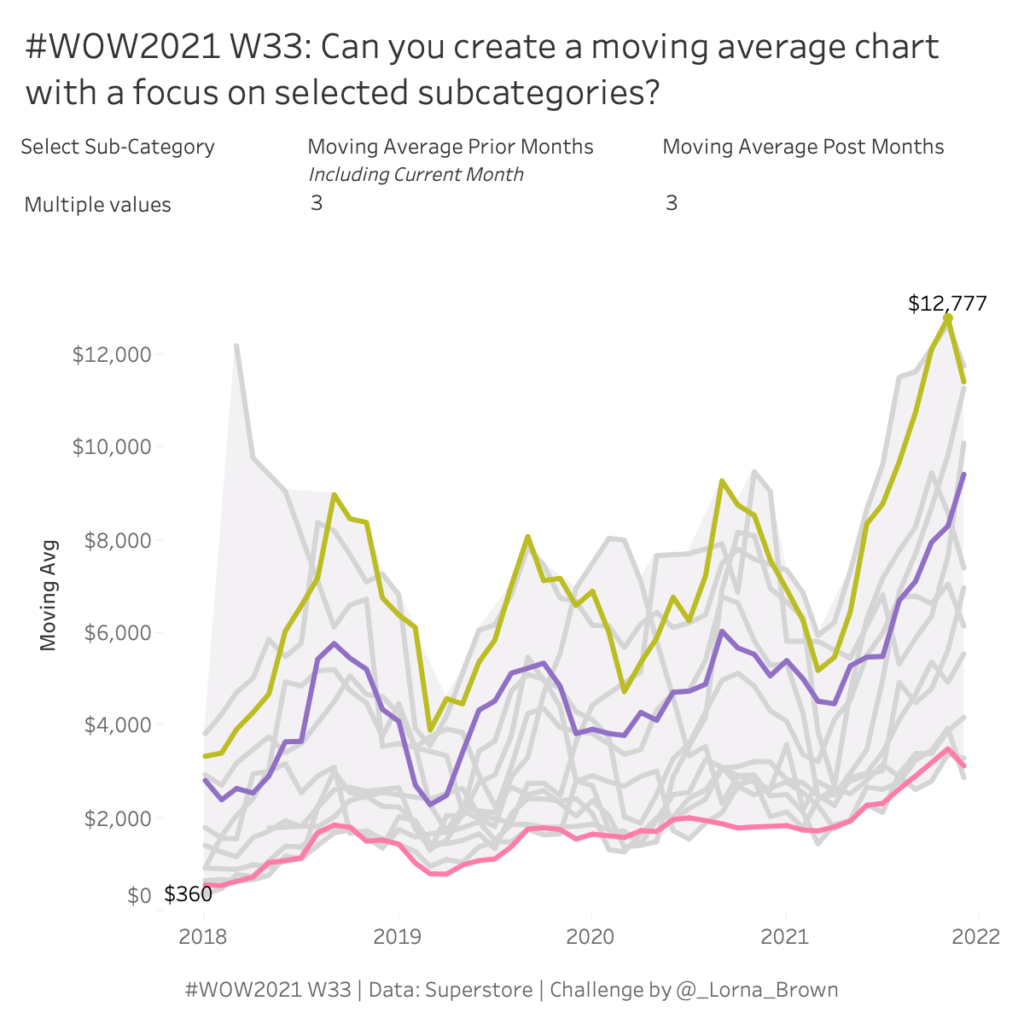
2021 Week 33 | Tableau: Can you create a moving average chart with a focus on selected subcategories?
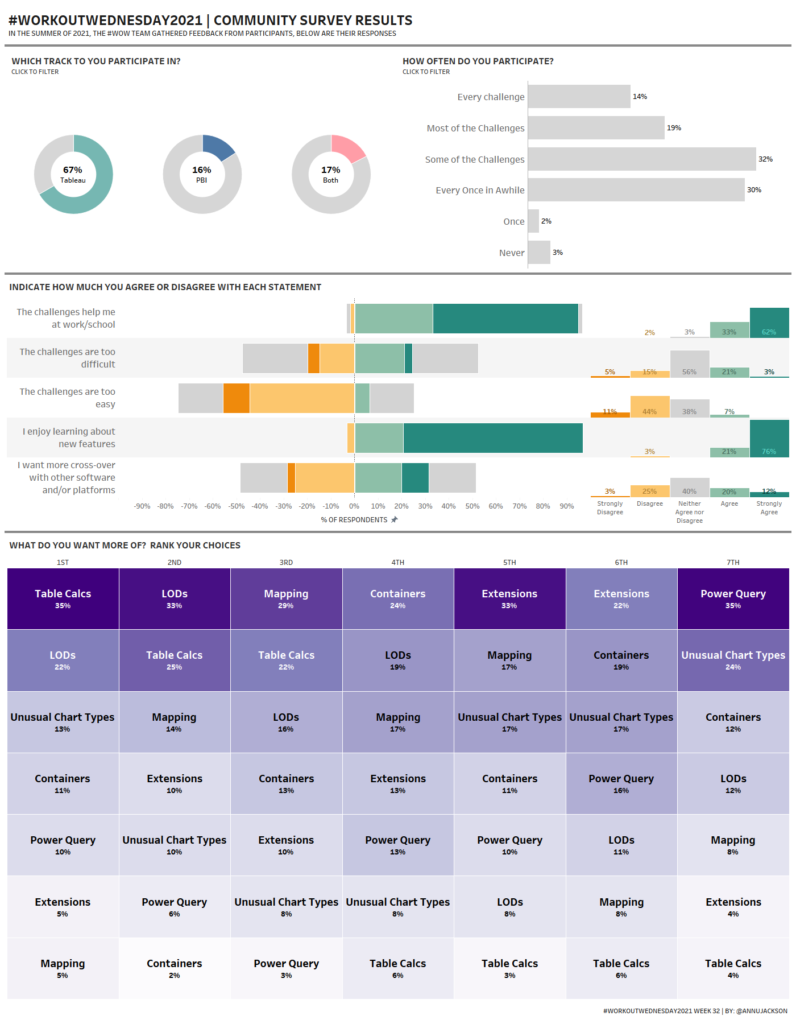
Introduction After the results of the community survey, the top ranked feature was Table Calculations, so guess what? Let’s do some Table Calculations! Click to open in Tableau Public Requirements Dashboard 600 x 600 ONE SHEET Table Calcs ONLY! Create a parameter controlled moving average by month for sales. Create a way to multi-select subcategories …