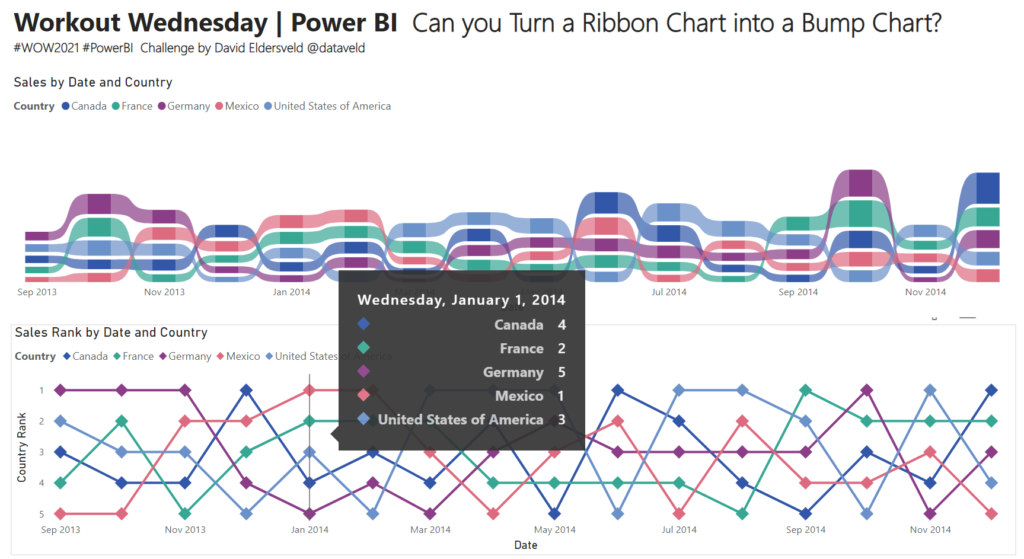
2021 Week 16 | Power BI: Intro to Charticulator
Introduction Thanks to everyone who has ben participating in #WorkoutWednesday – Power BI edition! We have had an amazing 953 submissions for the Power BI challenges at the time of writing this post. If you haven’t been submitting your tracker upon completion, make sure to fill it out at this link. This week we are …