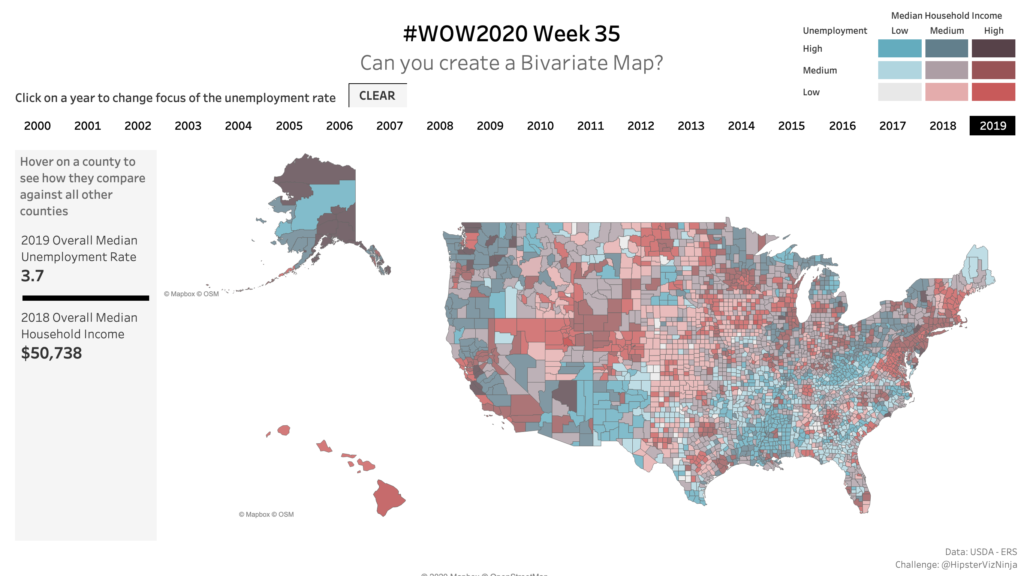
#WOW2020 week 35 | Can you build a bivariate map?
Introduction Hi friends! Well, it’s been a quarter since my last challenge so you know what that means, it means we’ve got a new version of Tableau to check out! A couple weeks ago, 2020.3 was released and with it came a whole host of new awesome features and functionality! As always, #WOW2020 is here …